The AAPG/Datapages Combined Publications Database
AAPG Bulletin
Figure
AAPG Bulletin; Year: 2023; Issue: May DOI: 10.1306/09142221207
Return to Full Text
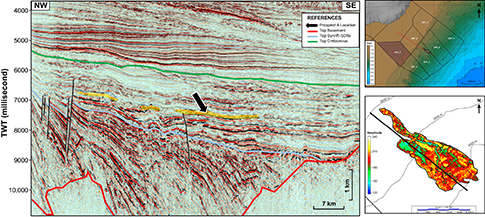
Figure 4.
Northwest-southeast dip seismic line across prospect A showing the geometry of the mapped stratigraphic pinchout trap (Gristo et al., 2021). Maps to the right show the study area (top) and the prospect outline (bottom). The seismic polarity is Society of Exploration Geophysicists standard. The black lines on the seismic data are faults (interpretation by Administracion Nacional de Combustibles, Alcohol y Portland). The black lines on the upper inset map are exploration block boundaries. The red line is the line of section. The thick black line on the lower inset map corresponds to the extent of the interpreted amplitude versus offset anomaly displayed on the seismic cross section (yellow area that is arrowed on the seismic cross section), and the thin lines are depth contours of the seafloor. Seismic data and interpretation courtesy of the Administracion Nacional de Combustibles, Alcohol y Portland. OFF = offered exploration block; TWT = two-way traveltime.
Figure 4. Northwest-southeast dip seismic line across prospect A showing the geometry of the mapped stratigraphic pinchout trap (Gristo et al., 2021). Maps to the right show the study area (top) and the prospect outline (bottom). The seismic polarity is Society of Exploration Geophysicists standard. The black lines on the seismic data are faults (interpretation by Administracion Nacional de Combustibles, Alcohol y Portland). The black lines on the upper inset map are exploration block boundaries. The red line is the line of section. The thick black line on the lower inset map corresponds to the extent of the interpreted amplitude versus offset anomaly displayed on the seismic cross section (yellow area that is arrowed on the seismic cross section), and the thin lines are depth contours of the seafloor. Seismic data and interpretation courtesy of the Administracion Nacional de Combustibles, Alcohol y Portland. OFF = offered exploration block; TWT = two-way traveltime.