The AAPG/Datapages Combined Publications Database
AAPG Bulletin
Figure
AAPG Bulletin; Year: 2023; Issue: May DOI: 10.1306/09142221207
Return to Full Text
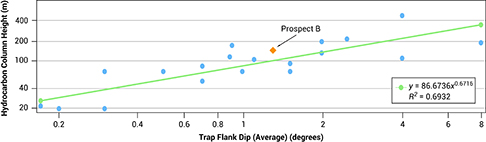
Figure 9.
Hydrocarbon column height versus trap flank dip crossplot for the shallow-marine sandstone stratigraphic trap analogues. Prospect B follows the trend line. Blue circles indicate parameter values from analogue reservoirs. R2 = coefficient of determination.
Figure 9. Hydrocarbon column height versus trap flank dip crossplot for the shallow-marine sandstone stratigraphic trap analogues. Prospect B follows the trend line. Blue circles indicate parameter values from analogue reservoirs. R2 = coefficient of determination.