The AAPG/Datapages Combined Publications Database
AAPG Bulletin
Figure
AAPG Bulletin; Year: 2023; Issue: May DOI: 10.1306/09232222051
Return to Full Text
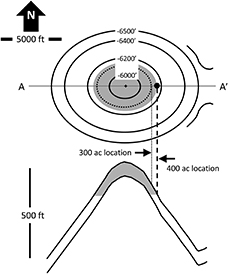
Figure 1.
Example prospect and schematic cross section used for prospect assessment. The prospect has a probability of geological success of 50%, which incorporates a trap chance of 80%. The dotted contour encloses 300 ac, which is the 90th percentile of the productive area distribution. The vertical dashed line represents a well drilled with 400 ac updip from the location to the −5950-ft crest. The vertical dotted line represents a well location with 300 ac updip. Note how a discovery drilled at the 300-ac location could actually have a productive area closer to 400 ac due to the lower oil–water contact.
Figure 1. Example prospect and schematic cross section used for prospect assessment. The prospect has a probability of geological success of 50%, which incorporates a trap chance of 80%. The dotted contour encloses 300 ac, which is the 90th percentile of the productive area distribution. The vertical dashed line represents a well drilled with 400 ac updip from the location to the −5950-ft crest. The vertical dotted line represents a well location with 300 ac updip. Note how a discovery drilled at the 300-ac location could actually have a productive area closer to 400 ac due to the lower oil–water contact.