The AAPG/Datapages Combined Publications Database
AAPG Bulletin
Figure
AAPG Bulletin; Year: 2023; Issue: May DOI: 10.1306/09232222051
Return to Full Text
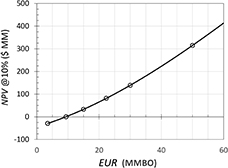
Figure 15.
Development comparative net present value (NPV@10%) versus estimated ultimate recovery (EUR) curve built as a polynomial best fit to seven cases shown in Figure 13 (only the six smallest cases shown). This curve is before the impact of exploration and appraisal costs, and the time value of production delay in the case of appraisal. $MM = million dollars; MMBO = million barrels of oil.
Figure 15.
Development comparative net present value (NPV@10%) versus estimated ultimate recovery (EUR) curve built as a polynomial best fit to seven cases shown in