The AAPG/Datapages Combined Publications Database
AAPG Bulletin
Figure
AAPG Bulletin; Year: 2023; Issue: May DOI: 10.1306/09232222051
Return to Full Text
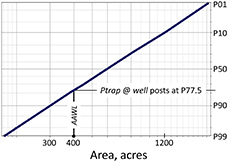
Figure 4.
Example prospect productive area distribution plotted in a log-probit coordinate system. The vertical line represents a 400-ac area associated with the well location (AAWL). This area posts at the 77.5th percentile (P77.5), which is used to generate the chance that the downdip location will be a discovery (Pwell) by applying the formula defined in the text. Ptrap @ well = percentile location on the area distribution that the area updip of the well location is found.
Figure 4. Example prospect productive area distribution plotted in a log-probit coordinate system. The vertical line represents a 400-ac area associated with the well location (AAWL). This area posts at the 77.5th percentile (P77.5), which is used to generate the chance that the downdip location will be a discovery (Pwell) by applying the formula defined in the text. Ptrap @ well = percentile location on the area distribution that the area updip of the well location is found.