The AAPG/Datapages Combined Publications Database
AAPG Bulletin
Figure
AAPG Bulletin; Year: 2023; Issue: May DOI: 10.1306/09232222051
Return to Full Text
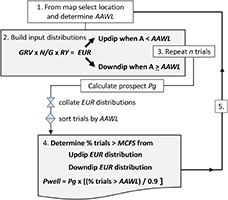
Figure 5.
Workflow map used to generate the chance the downdip location will be a discovery (Pwell) and updip and downdip estimated ultimate recovery (EUR) distributions. Gross rock volume (GRV), net-to-gross (N/G), and recovery yield (RY) represent the input distributions (GRV, N/G, and RY) defined in the text, which when multiplied generate the EUR distribution. In this simulation, n = 20,000 trials were computed for each specific downdip well location selected. A = productive area sampled in the simulation; AAWL = area associated with the well location; MCFS = minimum commercial field size; Pg = probability of geologic success.
Figure 5. Workflow map used to generate the chance the downdip location will be a discovery (Pwell) and updip and downdip estimated ultimate recovery (EUR) distributions. Gross rock volume (GRV), net-to-gross (N/G), and recovery yield (RY) represent the input distributions (GRV, N/G, and RY) defined in the text, which when multiplied generate the EUR distribution. In this simulation, n = 20,000 trials were computed for each specific downdip well location selected. A = productive area sampled in the simulation; AAWL = area associated with the well location; MCFS = minimum commercial field size; Pg = probability of geologic success.