The AAPG/Datapages Combined Publications Database
AAPG Bulletin
Figure
AAPG Bulletin; Year: 2023; Issue: May DOI: 10.1306/09232222051
Return to Full Text

Figure 6.
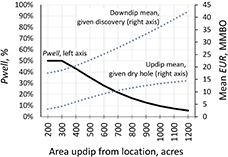
Plot of chance the downdip location will be a discovery (Pwell ), on the left y axis for each downdip location shown decreasing, whereas the mean of the associated downdip and updip estimated ultimate recovery (EUR) distributions (right y axis) increase. MMBO = million barrels of oil.

Figure 6. Plot of chance the downdip location will be a discovery (Pwell ), on the left y axis for each downdip location shown decreasing, whereas the mean of the associated downdip and updip estimated ultimate recovery (EUR) distributions (right y axis) increase. MMBO = million barrels of oil.