The AAPG/Datapages Combined Publications Database
AAPG Bulletin
Figure
AAPG Bulletin; Year: 2023; Issue: May DOI: 10.1306/09232222051
Return to Full Text
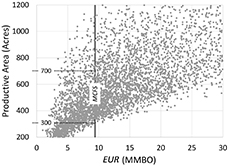
Figure 7.
Crossplot of productive area (acres) and resulting estimated ultimate recovery (EUR, millions of barrels of oil [MMBO]) for 5000 trials randomly selected from the 20,000-trial simulation. The vertical line is the minimum commercial field size (MCFS). Analysis of the 300- and 700-ac locations is described in the text.
Figure 7. Crossplot of productive area (acres) and resulting estimated ultimate recovery (EUR, millions of barrels of oil [MMBO]) for 5000 trials randomly selected from the 20,000-trial simulation. The vertical line is the minimum commercial field size (MCFS). Analysis of the 300- and 700-ac locations is described in the text.