The AAPG/Datapages Combined Publications Database
AAPG Bulletin
Figure
AAPG Bulletin; Year: 2023; Issue: May DOI: 10.1306/09232222051
Return to Full Text
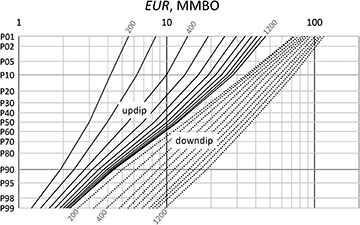
Figure 9.
Updip and downdip (dotted) estimated ultimate recovery (EUR) distributions for the 11 well locations assessed in 100-ac increments between 200 and 1200 ac. Each curve connects the 99th percentile (P99), P90, P50, P10, and P01 values of the distribution. See Table 2 for the P99, P01, and mean of each distribution. The downdip distributions represent the prospect crest to the base of hydrocarbons in the well, plus the remaining EUR distribution from the base of the hydrocarbons in the well to the hydrocarbon water contact, rather than being limited to that portion downdip of the location. MMBO = million barrels of oil.
Figure 9.
Updip and downdip (dotted) estimated ultimate recovery (EUR) distributions for the 11 well locations assessed in 100-ac increments between 200 and 1200 ac. Each curve connects the 99th percentile (P99), P90, P50, P10, and P01 values of the distribution. See