The AAPG/Datapages Combined Publications Database
AAPG Bulletin
Figure
AAPG Bulletin; Year: 2023; Issue: July DOI: 10.1306/10242221068
Return to Full Text
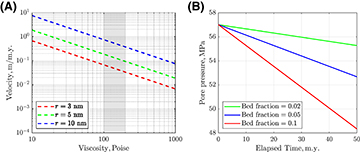
Figure 11.
(A) The dashed lines represent the vertical Stokes velocity of gas bubbles that depends on the bitumen viscosity. The shaded region denotes the likely bitumen viscosities. The oil and gas velocities through the bitumen are comparable to the hydrocarbon escape velocity driven by buoyancy. (B) The pore pressure is preserved in a source rock because of the paucity of flow paths for the hydrocarbons. The low velocity of the gas bubbles governed by the Stokes’ law maintains overpressure for a long time. The pore pressure loss as a result of gas escape is only 10 MPa per 50 m.y. if the gas flows through 10% of the bed surface. r = radius of gas bubbles.
Figure 11.
(A) The dashed lines represent the vertical Stokes velocity of gas bubbles that depends on the bitumen viscosity. The shaded region denotes the likely bitumen viscosities. The oil and gas velocities through the bitumen are comparable to the hydrocarbon escape velocity driven by buoyancy. (B) The pore pressure is preserved in a source rock because of the paucity of flow paths for the hydrocarbons. The low velocity of the gas bubbles governed by the Stokes’ law maintains overpressure for a long time. The pore pressure loss as a result of gas escape is only 10 MPa per 50 m.y. if the gas flows through 10% of the bed surface.