The AAPG/Datapages Combined Publications Database
AAPG Bulletin
Figure
AAPG Bulletin; Year: 2023; Issue: July DOI: 10.1306/10242221068
Return to Full Text
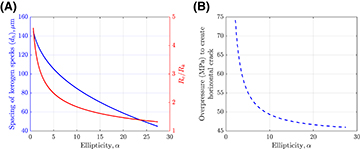
Figure 12.
(A) Ellipticity represents flatness of the kerogen specks. Higher ellipticity means flatter kerogen specks and less distance between them (blue curve). The red curve depicts the maximum value of the ratio of the crack radius to the kerogen speck radius, Rc /Rk , when horizontal cracks connect. For flatter kerogen specks (higher α), this ratio decreases, because the kerogen specks are closer to each other. (B) As the kerogen speck ellipticity increases, the initial overpressure required to initiate the horizontal crack decreases. The stress ratio for this simulation is σh /σv = 0.75. σh = horizontal stress; σv = vertical stress; dh = horizontal distance between kerogen specks.
Figure 12.
(A) Ellipticity represents flatness of the kerogen specks. Higher ellipticity means flatter kerogen specks and less distance between them (blue curve). The red curve depicts the maximum value of the ratio of the crack radius to the kerogen speck radius,