The AAPG/Datapages Combined Publications Database
AAPG Bulletin
Figure
AAPG Bulletin; Year: 2023; Issue: July DOI: 10.1306/10242221068
Return to Full Text
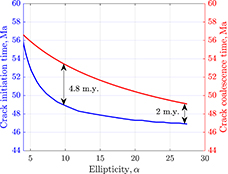
Figure 13.
Crack initiation time decreases sharply with α > 0 → 10 because of the high overpressure, ΔP , required for the initiation. The coupled effect of horizontal distance, dh , between kerogen specks and the stress concentration at the crack tips controls the crack coalescence time (red curve). For almost spherical kerogen specks (α < 4), the crack coalescence time is small in response to a sudden release of very high stress concentration. The crack coalescence time increases to the maximum of 4.8 Ma, for α = 10, and then decreases to 2 Ma for the more closely spaced kerogen specks of higher ellipticity. The stress ratio for this simulation is σh /σv = 0.75. σh = horizontal stress; σv = vertical stress.
Figure 13.
Crack initiation time decreases sharply with α > 0 → 10 because of the high overpressure, Δ