The AAPG/Datapages Combined Publications Database
AAPG Bulletin
Figure
AAPG Bulletin; Year: 2023; Issue: August DOI: 10.1306/04042322097
Return to Full Text
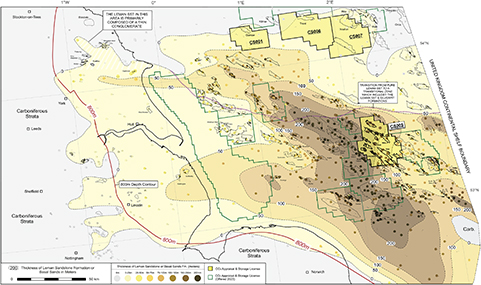
Figure 24.
Rotliegend Group thickness maps showing the location of the main northwest-southeast–striking axis of deposition (in Sole Pit) and the marked effect that differential subsidence had in controlling depositional thicknesses around its margins (e.g., Inde high, Cleaver Bank, and the East Midlands shelf areas). Updated after Alberts and Underhill (1990) and Doornebal and Stevenson (2010). Carb. = Carboniferous strata; Fm. = Formation; SST = Sandstone.
Figure 24. Rotliegend Group thickness maps showing the location of the main northwest-southeast–striking axis of deposition (in Sole Pit) and the marked effect that differential subsidence had in controlling depositional thicknesses around its margins (e.g., Inde high, Cleaver Bank, and the East Midlands shelf areas). Updated after Alberts and Underhill (1990) and Doornebal and Stevenson (2010). Carb. = Carboniferous strata; Fm. = Formation; SST = Sandstone.