The AAPG/Datapages Combined Publications Database
AAPG Bulletin
Figure
AAPG Bulletin; Year: 2023; Issue: August DOI: 10.1306/04042322097
Return to Full Text
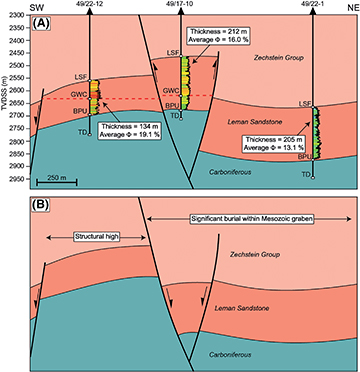
Figure 29.
Schematic cross sections through the Ganymede field (after Leveille et al., 1997a, b). The present-day structural high targeted by well 49/17-10 contains thicker but lower porosity sands than adjacent lows. The burial history of the area can explain this. The block lay in the hanging wall to a normal fault active during stages from late Paleozoic to Cretaceous (B). Although a schematic cartoon shows how the reservoir was more deeply buried during the Triassic–Jurassic, leading to a reduction in porosity, no absolute depths have been calculated and hence, values are omitted from the vertical axis. During the Cenozoic (A), the fault was reactivated to form a structural high. Effective porosity logs are shown for each well, where the values range from 0% (cool colors) to 25% (warm colors). Φ = porosity; BPU = Base Permian unconformity; GWC = gas–water contact; LSF = Leman Sandstone Formation; TD = total depth (of the borehole); TVDSS = true vertical depth subsea.
Figure 29. Schematic cross sections through the Ganymede field (after Leveille et al., 1997a, b). The present-day structural high targeted by well 49/17-10 contains thicker but lower porosity sands than adjacent lows. The burial history of the area can explain this. The block lay in the hanging wall to a normal fault active during stages from late Paleozoic to Cretaceous (B). Although a schematic cartoon shows how the reservoir was more deeply buried during the Triassic–Jurassic, leading to a reduction in porosity, no absolute depths have been calculated and hence, values are omitted from the vertical axis. During the Cenozoic (A), the fault was reactivated to form a structural high. Effective porosity logs are shown for each well, where the values range from 0% (cool colors) to 25% (warm colors). Φ = porosity; BPU = Base Permian unconformity; GWC = gas–water contact; LSF = Leman Sandstone Formation; TD = total depth (of the borehole); TVDSS = true vertical depth subsea.