The AAPG/Datapages Combined Publications Database
AAPG Bulletin
Figure
AAPG Bulletin; Year: 2023; Issue: August DOI: 10.1306/04042322097
Return to Full Text
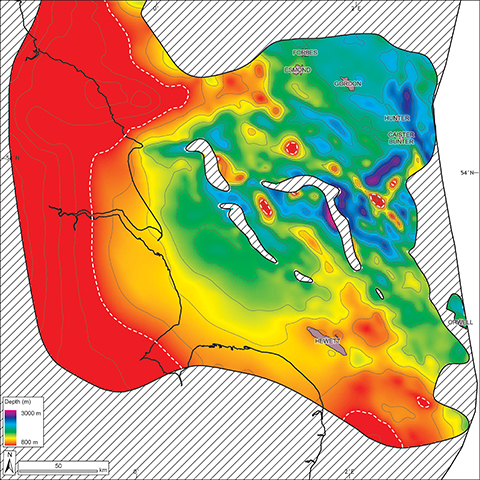
Figure 32.
Depth structure map for the Bunter Sandstone Formation. The map was created by gridding Bunter Sandstone well tops with a structural trend surface of the top Zechstein Group (Peryt et al., 2010). The white dashed line represents the 800 m contour below which pressure and temperatures are such that carbon dioxide would be expected to remain in its supercritical phase rather than a gaseous one that characterizes shallower depths.
Figure 32. Depth structure map for the Bunter Sandstone Formation. The map was created by gridding Bunter Sandstone well tops with a structural trend surface of the top Zechstein Group (Peryt et al., 2010). The white dashed line represents the 800 m contour below which pressure and temperatures are such that carbon dioxide would be expected to remain in its supercritical phase rather than a gaseous one that characterizes shallower depths.