The AAPG/Datapages Combined Publications Database
AAPG Bulletin
Figure
AAPG Bulletin; Year: 2023; Issue: November DOI: 10.1306/10152221163
Return to Full Text
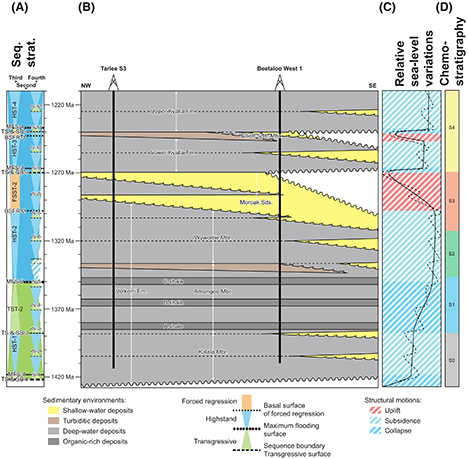
Figure 11.
Wheeler diagram showing sequence stratigraphic (Seq. Strat.) architecture (A), the distribution of the sedimentary facies in the Velkerri, Moroak, and Kyalla Formations (B), the variation of the relative sea level (C), and chemosequences (D) (chemosequences derived from Munday and Forbes, 2020). BSFR = basal surface of forced regression; Fm. = Formation; fs = flooding surface; FSST = falling stage systems tract; HST = highstand systems tract; Mbr. = Member; MFS = maximum flooding surface; SB = sequence boundary; Sds. = Sandstone; TS = transgressive surface; TST = transgressive systems tract.
Figure 11. Wheeler diagram showing sequence stratigraphic (Seq. Strat.) architecture (A), the distribution of the sedimentary facies in the Velkerri, Moroak, and Kyalla Formations (B), the variation of the relative sea level (C), and chemosequences (D) (chemosequences derived from Munday and Forbes, 2020). BSFR = basal surface of forced regression; Fm. = Formation; fs = flooding surface; FSST = falling stage systems tract; HST = highstand systems tract; Mbr. = Member; MFS = maximum flooding surface; SB = sequence boundary; Sds. = Sandstone; TS = transgressive surface; TST = transgressive systems tract.