The AAPG/Datapages Combined Publications Database
AAPG Bulletin
Full Text
![]() Click to view page images in PDF format.
Click to view page images in PDF format.
AAPG Bulletin, V.
DOI: 10.1306/10152221163
Stratigraphic architecture of the 1420–1210 Ma Velkerri and Kyalla Formations (Beetaloo Sub-basin, Australia)
Vincent Crombez,1 Marcus Kunzmann,2 Mohinudeen Faiz,3 Claudio Delle Piane,4 Stuart Munday,5 and Anne Forbes6
1Deep Earth Imaging – Future Science Platform, Energy, Commonwealth Scientific and Industrial Research Organisation (CSIRO), Kensington, Western Australia, Australia; present address: Encounter Resources Ltd, Subiaco, Western Australia, Australia, [email protected]
2Mineral Resources, CSIRO, Kensington, Western Australia, Australia; present address: Fortescue Metals Group, East Perth, Western Australia, Australia; [email protected]
3Energy, CSIRO, Pullenvale, Queensland, Australia; [email protected]
4Deep Earth Imaging – Future Science Platform, Energy, CSIRO, Kensington, Western Australia, Australia; [email protected]
5Chemostrat Australia, West Perth, Western Australia, Australia; [email protected]
6Chemostrat Australia, West Perth, Western Australia, Australia; present address: Wood Mackenzie, Perth, Western Australia, Australia; [email protected]
ABSTRACT
The Mesoproterozoic Velkerri and Kyalla Formations in the Beetaloo Sub-basin in northern Australia contain the world’s oldest shale plays. In unconventional exploration, the main challenge is the identification of sweet spots from which hydrocarbons can be produced economically. In fine-grained siliciclastic intervals, the distribution of these sweet spots is controlled mainly by the evolution of the sedimentary system and its effects on organic matter distribution. This work reconstructs the stratigraphic architecture of the Velkerri-Kyalla interval and integrates its interpreted stratigraphic evolution with chemostratigraphic and chronostratigraphic data sets. Based on core descriptions and well correlations, we reconstructed the facies distribution within the Velkerri-Kyalla interval along two regional well sections. This allowed stratigraphic stacking patterns to be observed and multiple depositional sequences to be identified. Three stratigraphic orders are observed within the Velkerri-Kyalla Formations. The studied interval is interpreted to comprise one second-order depositional sequence that contains four nested third-order depositional sequences. These, in turn, are composed of 13 nested fourth-order transgressive–regressive sequences. By integrating the sequence stratigraphic architecture with available geochronological constraints, we postulate a chronostratigraphic framework for these Mesoproterozoic strata. The Velkerri Formation was likely deposited between 1420 and 1300 Ma and the overlying Kyalla Formation between 1270 and 1210 Ma. Furthermore, by coupling the sequence stratigraphy, chemostratigraphy, existing provenance studies, and chronostratigraphy, we were able to construct regional paleogeographic maps to illustrate the evolution of the basin in the broader context of the Mesoproterozoic of northern Australia.
INTRODUCTION
Sweet spots in unconventional plays are formed by the co-occurrence of three elements: (1) hydrocarbon enrichment, (2) suitable geomechanical properties leading to fracture conductivity, and (3) good reservoir drive (Ottmann and Bohacs, 2014). This means that economic plays consist of hydrocarbon-bearing intervals with suitable reservoir conditions to recover high volumes of oil and/or gas after hydraulic stimulation. Two elements directly relate to the distribution of sedimentary heterogeneities in the play: hydrocarbon enrichment and geomechanical properties that are both controlled by the sedimentary facies, including mineral and organic contents. Consequently, understanding the distribution of sedimentary heterogeneities is critical when predicting the distribution of sweet spots in self-sourced reservoirs. In frontier exploration, the scale of the sedimentary heterogeneities that control the distribution and quality of these reservoirs is often subseismic (
The increasing interest in shale plays and the development of model-independent sequence stratigraphy (Catuneanu, 2006, 2019a; Catuneanu et al., 2009, 2010) have resulted in numerous basin-scale studies of fine-grained siliciclastic rocks (Passey et al., 2010; Kietzmann et al., 2014; Kohl et al., 2014; Borcovsky et al., 2017; Byun et al., 2018; Crombez et al., 2019; Knapp et al., 2019). These studies mainly focused on understanding the distribution of sedimentary facies and their stacking patterns (e.g., Van Buchem et al., 2005) and on defining or refining a stratigraphic framework (e.g., Smith and Bustin, 2000; Angulo and Buatois, 2012; Borcovsky et al., 2017). Important for exploration, understanding the stratigraphic architecture of a play allows its potential seismic expression to be tested (e.g., Zeller et al., 2015) and is also a prerequisite for sweet spot prediction using process-based models (e.g., Crombez et al., 2017).
Unconventional shale reservoir exploration in Australia currently focuses on the Mesoproterozoic Beetaloo Sub-basin located in northern Australia (Figure 1). Map-based estimates of the resources suggest 899 billion bbl (P50, or median estimates) of oil in place (OIP) for the Kyalla Formation and 85 billion bbl (P50) of OIP and 208 TCF (P50) of gas in place in the Amungee Member of the Velkerri Formation (Revie, 2017b). Although this resource potential has stimulated significant exploration activity (Hoffman, 2015; Close et al., 2017; Sheridan et al., 2018; Bruce and Garrad, 2021), the high-resolution, basin-scale stratigraphic architecture of this Mesoproterozoic interval has not yet been published.
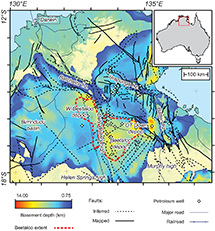 Figure 1. Location of the study area. This basement depth map highlights the extent of the greater McArthur area and the location of the Beetaloo Sub-basin. Note the occurrences of the deepest depocenters in structurally complex areas and over the Beetaloo Sub-basin. (Data from Frogtech Geoscience, 2018
Here, we reconstruct the stratigraphic architecture of the Velkerri and Kyalla Formations and the Moroak Sandstone in the Beetaloo Sub-basin. Using publicly available wire-line log and geochemical data from wells arranged along north-south and east-west cross sections we (1) reconstruct the spatial and stratigraphic facies distribution, (2) identify stacking patterns, and (3) reconstruct a sequence stratigraphic framework. This process allows us to assess the controls on the sedimentary architecture, integrate the cyclicity in chrono- and chemostratigraphic frameworks, and discuss the basin-scale paleogeographic evolution of the Beetaloo Sub-basin.
GEOLOGICAL BACKGROUND
The Greater McArthur Basin and the Beetaloo Sub-basin
The greater McArthur Basin is an inclusive definition of the Paleoproterozoic–Mesoproterozoic sedimentary basins located in the Northern Territory of Australia (Rawlings, 1999; Ahmad et al., 2013; Close, 2014). The thickest parts of the basin are thought to exceed 12 km (Figure 1; Frogtech Geoscience, 2018) and are located in structurally complex areas and the area defined as the Beetaloo Sub-basin (Beetaloo). The Beetaloo was first defined as a subbasin based on gravity and magnetic anomalies (Jackson et al., 1987; Plumb and Wellman, 1987). Today, this concealed subbasin is interpreted to extend over more than 60,000 km2. The limits of the Beetaloo Sub-basin have been recently updated and formalized by the Northern Territory Geological Survey and have been constrained using lithostratigraphic data from wells tied to stratigraphic interpretations of the available two-dimensional (2-D) seismic surveys (Williams, 2019). Accordingly, the subbasin boundary is currently defined using the top of the Kyalla Formation, constrained by a cutoff depth of 400 m below the surface (Williams, 2019). It is noted that the current definition does not correspond to the extent of the sediments of interest for hydrocarbon exploration, and hydrocarbon plays have been identified beyond the extent of the geophysically defined boundary (Bruce and Garrad, 2021).
The Beetaloo lies on the North Australian craton (NAC) and is bound to the north by the Batchelor and Urapunga fault zones, to the east by the Batten fault zone and the Murphy high, to the south by the Helen Springs high, and the west by the Birrindudu Basin. It comprises three distinct depocenters, including the eastern Beetaloo depocenter separated from the western Beetaloo depocenter by the Daly Waters high and the OT Downs depocenter (Figure 1). Although the petroleum wells and regional seismic data highlight relatively flat-lying Proterozoic strata (Figure 2A), the greater McArthur Basin fill records the formation and breakup of different supercontinents (e.g., Myers et al., 1996; Pisarevsky et al., 2014; Mulder et al., 2015; Meert and Santosh, 2017). Its stratigraphy is traditionally subdivided into four nongenetic packages; the youngest package is the Wilton package and comprises the Roper Group (Rawlings, 1999). Geochronology studies based on detrital zircons, Re-Os analyses, and dating of intrusions suggest Mesoproterozoic ages for the Roper Group (Jackson et al., 2000; Kendall et al., 2009; Yang et al., 2018), which contains the Velkerri and Kyalla Formations (Figure 2B). This interval mainly comprises siliciclastic sedimentary rocks (Powell et al., 1987; Donnelly and Crick, 1988; Jackson et al., 1988; Abbott and Sweet, 2000; Munson, 2016) that have been intruded by Mesoproterozoic dolerite dykes and sills (Tucker and Boyd, 1987; Abbott et al., 2001).
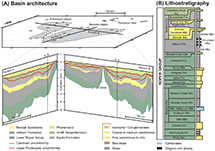 Figure 2. (A) Two-dimensional cross sections from the subsurface of the Beetaloo Sub-basin. Note the Daly Waters high (DWH) dividing the subbasin into two depocenters. (B) Simplified lithostratigraphy of the Roper Group (modified from Rawlings, 1999). This study focuses on the Velkerri-Kyalla interval. Fm. = Formation; Mbr. = Member; Mtn. Valley Lst. = Mountain Valley Limestone; S. = Section; Sds. = Sandstone; Sst. = Siltstone; Undif. = undifferentiated; W-Beetaloo = western Beetaloo.
Paleogeographic reconstructions suggest that the NAC occupied a position at approximately 30°N during the deposition of the Roper Group (Pisarevsky et al., 2014; Meert and Santosh, 2017). At the time, the NAC was located to the east of western Laurentia. In these geodynamical reconstructions, the deposition of the Roper Group is linked to the breakup of the Nuna supercontinent and the initiation of a rift system between Laurentia and the NAC (Mulder et al., 2015). The major unconformity at the base of the Roper Group is attributed to the Isan Orogeny (de Vries et al., 2008; Blaikie and Kunzmann, 2020) and includes the inversion of preexisting structures (Lindsay, 2001). Although the deposition of the Roper Group started in an active geodynamical setting, most recent studies suggest that an intracratonic setting influenced by flexural tectonics was responsible for the deposition of the interval comprising the Velkerri to Kyalla Formations (Lanigan et al., 1994; Abbott and Sweet, 2000).
The Velkerri-Kyalla Interval
The Velkerri and Kyalla Formations and Moroak Sandstone occur in the upper part of the Roper Group (Figure 2B). The Velkerri Formation is divided into three members, from oldest to youngest: the Kalala, Amungee, and Wyworrie Members (Munson and Revie, 2018). The exact duration and age of the Velkerri Formation are still debated. The Re-Os dating suggests that the Velkerri Formation was deposited from 1417 ± 29 Ma to 1361 ± 21 Ma (Kendall et al., 2009); however, based on the results of detrital zircon geochronology studies, Yang et al. (2018) proposed maximum depositional ages of 1308 ± 41 Ma and 1313 ± 47 Ma. More recent work by Yang et al. (2020b) suggests that the Kyalla Formation was deposited before 1092 ± 16 Ma.
The lithological characteristics of the Velkerri and Kyalla Formations and Moroak Sandstone have been extensively studied by Powell et al. (1987), Munson (2016), and Munson and Revie (2018). The Velkerri Formation is composed mainly of interlaminated and interbedded siltstone and claystone, with minor fine-grained sandstone and rare dolomitized limestone. The conformably to unconformably overlying Moroak Sandstone likely represents the proximal part of the sedimentary system (Powell et al., 1987; Warren et al., 1998; Abbott and Sweet, 2000). It consists predominantly of fine- to medium-grained sandstone, interlayered with minor coarse-grained sandstone, conglomerate, and siltstone (Munson, 2016). The conformably overlying Kyalla Formation is composed mainly of siltstone, silty claystone, and rare occurrences of claystone. However, a thick sandstone interval, referred to as the Elliott Sandstone Member, can be distinguished between the lower and upper parts (Munson, 2016).
It is generally accepted that the Velkerri and Kyalla Formations and Moroak Sandstone were deposited on a continental shelf (Abbott and Sweet, 2000; Munson, 2016), with depositional environments ranging from shallow marine deltaic to offshore (Warren et al., 1998), as evidenced by the characteristic sedimentary features for wave- and fluvial-dominated environments (Gorter and Grey, 2012; Munson, 2016; Sheridan et al., 2018).
Three organic-rich intervals, referred to as the A, B, and C shales, occur in the Amungee Member of the Velkerri Formation (Munson and Revie, 2018; Cox et al., 2022). In addition, high organic carbon contents have been reported in the lower Kyalla Formation (Jarrett et al., 2019a, b). Recent biomarker studies indicate that the organic matter in these sediments is derived from biomass dominated by bacteria, with minor input from archaea and eukaryotes (Jarrett et al., 2019a). Total organic carbon in individual shale units can exceed 12 wt. %, with the present-day hydrogen index up to 800 mg
DATA SET AND METHODS
Data Set
Data from 32 wells were studied to reconstruct the stratigraphic architecture of the Velkerri-Kyalla interval. Among these wells, 25 intersected the Velkerri Formation, 16 intersected the Moroak Sandstone, and 19 intersected the Kyalla Formation (Appendix Table 1 [supplementary material available as AAPG Datashare 171 at www.aapg.org/datashare]). The available gamma-ray (GR) logs were loaded in EasyTrace, well-log interpretation software distributed by Beicip-Franlab, allowing for the creation of correlation panels. In addition to the GR logs, cored intervals from eight wells were studied for facies descriptions (Appendix Table 2 [supplementary material available as AAPG Datashare 171 at www.aapg.org/datashare]).
The Beetaloo Basin chemostratigraphic zonation scheme was defined internally by Chemostrat Australia on offset legacy wells using available elemental data from the greater McArthur area (Chemostrat Australia, 2014, 2016; Origin Energy Resources, 2015a, b, 2016; Cox et al., 2016; Munday, 2020; Munday and Forbes, 2020). The wells correlated into this scheme include Amungee NW 1, Beetaloo W 1, Kalala South 1, McManus 1, Shenandoah 1, Alexander 1, Scarborough 1, Lady Penrhyn 1, and Altree 2. The elemental data (both major and trace elements) used for the chemostratigraphic correlation across these wells were derived from multiple operators using a range of x-ray fluorescence (XRF) instruments (both calibrated handheld XRF and laboratory XRF), as well as inductively coupled plasma-optical emission spectrometry and inductively coupled plasma-mass spectrometry analytical techniques.
Chemostratigraphy relies on the study of the geochemical variation in sedimentary rocks, typically being variable and sensitive to subtle shifts in provenance region or mechanisms of deposition (e.g., seawater and organic matter interaction). Successions that appear lithologically uniform often record variations in the geochemistry of their mineral components or the abundance and proportions of accessory minerals (e.g., heavy and clay minerals, some of which have very distinctive trace element signatures). Chemostratigraphy can define zones with similar geochemical signatures and their correlations at various scales, analogous to a lithostratigraphic hierarchical scheme.
Methods
Sedimentary and Well-Log Facies
High-resolution images of cores (from Hylogger data sets) were accessed through the AuScope portal (portal.auscope.org); from the images, 2430 m of core distributed across eight wells were described. Sedimentological descriptions at a 1:200 scale focused on the identification of sedimentary structures and textures to define a facies model (sensu Walker, 1992). Because not all wells cored the Velkerri and Kyalla Formations and Moroak Sandstone, we integrated our facies descriptions with well-log patterns (sensu Posarnentier and Allen, 1999), placing particular focus on the GR logs (e.g., Crombez et al., 2016). The GR logs were the most commonly acquired log type during the 40 yr of drilling the wells. In the Velkerri-Kyalla interval, the mineralogy mostly reflects terrigenous material, with very little carbonate content observed (Revie, 2017a). Assuming that the GR values approximate the abundance of K-rich micas mostly present in fine-grained material in the Velkerri-Kyalla interval, this log can be used to distinguish the proximal, more coarse-grained, sand-rich environments from the fine-grained, distal part of the sedimentary system. The GR logs can also help to identify organic-rich marine intervals that are likely to be enriched in U.
Sequence Stratigraphy
We reconstructed the stratigraphic architecture of the Velkerri-Kyalla interval along two 2-D sections (Figure 1). Using sedimentological descriptions and GR logs to understand the distribution of sedimentary environments and to identify stacking patterns, we interpreted the sequence stratigraphic evolution following a model-independent approach (sensu Catuneanu et al., 2009, 2011; Catuneanu, 2019a). We focused on shoreline trajectories (Helland-Hansen and Martinsen, 1996; Helland-Hansen and Hampson, 2009) that resulted in the development of different stratigraphic surfaces and systems tracts, and followed the terminology defined by Hunt and Tucker (1992) and Helland-Hansen and Gjelberg (1994). The present work proposes a three-dimensional stratigraphic framework for this Mesoproterozoic hydrocarbon play and integrates the framework with the available chronostratigraphic and chemostratigraphic data sets. The sparse data set and poor age control mean that we assume that the observed deepening and shallowing trends are the consequence of relative sea level rise and fall, and the paleoshoreline moved synchronously across the basin. Based on these interpretations, it is implied that the identified transgressions and normal and forced regressions were synchronous. Indeed, in this case study, we cannot identify with confidence the coeval deposition of transgressive and normal or forced-regressive systems tracts resulting from the spatially different sediment supplies or local structural movements.
RESULTS
From Cores to Well Logs
Sedimentary Facies and Environments
Based on the sedimentary facies identification criteria (Figure 3), four main facies associations were identified from the core descriptions (E1–E4, Figure 4). It is noted that the limited quantity of data meant that it was not possible to consistently distinguish between wave- and fluvial-dominated areas (sensu Ainsworth et al., 2011). Therefore, we group delta-front and foreshore environments in E1: fluvial-influenced foreshore environments and shorefaces and prodeltas in E2: fluvial-influenced shoreface environments. Two other environments are distinguished—turbiditic (E3) and offshore transition to offshore (E4). Here, we chose the wave domination over the fluvial domination because of the lack of observed unidirectional current structures and the abundance of wavy and tangential bedded strata, which are interpreted as the basin being wave dominated and fluvial influenced.
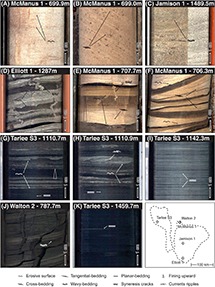 Figure 3. Sedimentary facies from cores intersecting the Velkerri-Kyalla interval. (A) Submassive sandstone; (B) cross-bedded sandstone; (C) wavy-bedded sandstone; (D) heterolithic sandstone and shale with syneresis cracks; (E) heterolithic sandstone and shale with syneresis cracks and tangential bedding; (F) heterolithic wavy-bedded sandstone and shale with syneresis cracks and tangential bedding; (G) heterolithic wavy- to planar-bedded sandstone and shale with fining-upward trends and erosive surfaces; (H) heterolithic wavy- to planar-bedded sandstone and shale with unidirectional current ripples and erosive surfaces; (I) heterolithic planar-bedded sandstone and shale; (J) heterolithic wavy-bedded sandstone and shale; (K) massive to planar-bedded shale.
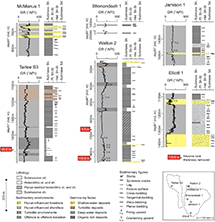 Figure 4. Synthetic facies description from studied drill cores. Identified facies reflect wave- to fluvial-dominated sedimentary environments. At the scale of the descriptions, and with the data available, no tide-dominated deposits were identified. GR = gamma ray; Het. = heterolithic; Pl. = planar-bedded; Sd. = sandstone; Sh. = shale; St. = siltstone; Submass. = submassive.
The fluvial-influenced foreshore environments (E1) are composed of planar-bedded, light gray to beige, fine-grained sandstone and siltstone. They preserve cross-bedding (Figure 3B), sometimes submassive (Figure 3A), or slightly wavy bedded (Figure 3C). They are often marked by an erosional base with gravel lags (Figure 4). The planar- to cross-bedded sandstones reflect deposition in shallow marine environments, either in foreshores or upper shorefaces (Walker and Plint, 1992) or in reworked sand bars (Bhattacharya and Walker, 1992). The large number of erosion surfaces and lags likely reflect storm or fluvial events on the margin.
The fluvial-influenced shoreface environments (E2) are composed of wavy-bedded, light to dark gray, heterolithic siltstone and shale. In this environment, fining-upward cycles (centimeters to meters scale) preserving syneresis cracks (Figure 3D, E) and tangential bedding (Figure 3E, F) are common (Figure 4). The occurrence of fining-upward cycles, wavy bedding, and heterolithic deposits are interpreted to be controlled by fair- and storm-weather wave oscillatory currents (Dumas and Arnott, 2006; Suter, 2006). Furthermore, variation in the river’s flow regime likely affected the grain size of the sediments delivered to the basin, explaining the heterolithic nature of this environment. Syneresis cracks are interpreted to reflect the mixing of fresh and seawater (Plummer and Gostin, 1981), attesting to the presence of rivers delivering fresh water to the system.
The turbiditic environments (E3) are composed of heterolithic planar-bedded, dark to light gray siltstone (Figure 3I). Fining- and coarsening-upward trends can be present (Figure 3G), as can rare current ripples (Figure 3H). These sediments are often surrounded by planar-bedded, dark gray shale and fine-grained siltstone with tangential bedding (Figure 4). In this facies, the planar-bedded siltstones are interpreted to represent distal lobe deposits formed on the shelf (Bouma, 1964; Walker, 1992). The fining-upward trends in the siltstones, together with the tangential bedding preserved in the shales surrounding the coarser interval, likely reflect the episodic evolution of the system controlled by periods of a higher flow regime in the river system feeding the basin.
Offshore transition to offshore environments (E4) are composed of planar-bedded to massive shale and fine-grained siltstone (Figure 3K). Minor erosive surfaces, tangential bedding, fining upward, and wavy-bedded (Figure 3J) intervals are often present, whereas syneresis cracks are rare. Here, the planar bedding is attributed to hyperpycnal flows settling. Rare tangential bedding is interpreted to reflect either turbidite flows or storm-induced currents (Dumas and Arnott, 2006). The occurrence of small reactivation surfaces or erosive surfaces are also interpreted to be related to episodic storm activity or unidirectional currents (Macquaker et al., 2010). The massive dark gray to black facies is interpreted to represent the deepest part of the sedimentary system and to reflect mainly pelagic settling below the storm wave base (Stow and Piper, 1984; Stow et al., 2001).
Overall, the Velkerri and Kyalla Formations and Moroak Sandstone represent wave-dominated environments ranging from the foreshore and the upper and lower shoreface to the offshore. In this wave-dominated framework, the offshore transition reflects environments between storm- and fair-weather wave bases, whereas the shoreface-foreshore boundary is placed at the base of the low tide level. Although wave dominated, the occurrence of syneresis cracks within the Moroak Sandstone and the Kyalla Formation indicate the mixing of freshwater and salt water and therefore a fluvial influence. The interpretation of a fluvial-influenced depositional environment is further supported by the occurrence of gutters and unidirectional currents (Wilson et al., 2021) that confirm that sediments were deposited in a fluvial-influenced environment, with sediment flowing to a turbiditic system.
Sedimentary Environment and Well Log Facies
Using GR logs, we extend the interpretation of depositional environments to uncored wells intersecting the Velkerri and Kyalla Formations and the Moroak Sandstone. Although environmental reconstructions based on well logs are less precise compared with core logging, shoreline shifts can be reconstructed by distinguishing four GR facies (G1–G4, Figure 4). Shallow-water deposits (G1) often present low GR values and either have a sharp base or are located above decreasing GR trends. These low GR values are interpreted to reflect the high abundance of coarse-grained content in E1 environments. Sharp bases are the result of sudden changes in the sedimentary environment, whereas the gradual decrease in GR values is coincident with a coarsening-upward trend indicating shoreline progradation.
Turbidite deposits (G2) are marked by a blocky GR pattern alternating from medium to high GR values. This likely reflects shifts from silt-rich lobe deposits to the mud-rich levee and overbank deposits of E3. High GR values are typical for deep-water deposits of GR facies G3 and present a high-frequency variation that is likely linked to subtle lithologic changes in the lower shoreface (E2) to offshore (E4) deposits. Finally, the highest GR values occur in facies G4 representing the organic-rich black shales (from E4). In addition to the four GR facies, which represent different depositional environments, GR trends can be linked to transgressions and regressions. Although a gradual increase in the GR values (more than tens of meters) is interpreted to reflect a transgressive period, a gradual decrease in the GR values (more than tens of meters) is interpreted to reflect a regressive trend.
2-D Well Correlations
Our study is based on two well sections, oriented east-west and north-south. The east-west well section spans 466 km and comprises 15 wells (Figure 5). It extends from Broadmere 1 in the east to Sever 1 in the west. The second well section spans 348 km and also comprises 15 wells (Figure 6). It extends from Prince of Wales 1 in the north to Elliott 1 in the south. The top of the Moroak Sandstone is used as a datum in both sections, assuming it represents a pseudohorizontal surface. Because we aim to establish a quasi-chronostratigraphic framework, our correlations may diverge from the lithostratigraphic subdivision of this succession.
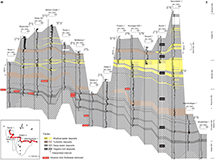 Figure 5. Interpreted facies distribution along a west-east well section. Note the thinning of the proximal deposit of the Amungee Member toward the west, not accompanied by sudden changes in facies and thickness across the Daly Waters high (located between Birdum Creek 1 and McManus 1). Fm. = Formation; GR = gamma ray; Mbr. = Member; Sds. = Sandstone.
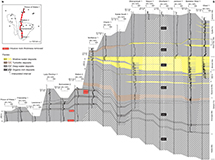 Figure 6. Interpreted facies distribution along a north-south section. Note the thinning of unit 2 (approximating Amungee Member) toward the north and onlapping of the uppermost shale (C shale) onto the middle shale (B shale) in the northern part of the basin. Fm. = Formation; GR = gamma ray; Mbr. = Member; Sds. = Sandstone.
In the east-west section, unit 1 (equivalent to the Kalala Member of the Velkerri Formation; Figure 5) records significant deepening from the top of the underlying Bessie Creek Sandstone. The sediments of this unit were deposited mainly below the storm wave base, interrupted by rare occurrences of shoreface deposits. Unit 1 records two transgressive–regressive (T-R) cycles. The top of the second cycle was previously highlighted by Hoffman (2015) as a continuous marker across the basin, being the only carbonate-rich interval. Unit 2 is 150–250 m thick (equivalent to the Amungee Member; Figure 5) and records deep-water deposition below the storm wave base, with minor to no shoreface influence and rare turbidite deposits. This interval records three significant peaks in the GR log, which often show a Christmas tree–like pattern, indicative of there being a high U concentration in the sediment-starved intervals (Crombez et al., 2020). The three high GR intervals match the definitions of the A, B, and C organic-rich shale intervals (Munson and Revie, 2018). The uppermost cycle generally represents the highest GR values and is inferred to record the highest concentration of fine material linked to the lowest sedimentation rate. We interpret this interval to represent the most distal part of the sedimentary system. Unit 3 (300–500 m, equivalent to the Wyworrie Member; Figure 5) comprises offshore to lower shoreface sedimentation. Siltstone beds are interpreted as thin, gravity flow deposits. Above these, two T-R cycles are recorded, although the abundance of turbidite deposits makes it more challenging to identify these cycles as clearly as those in unit 2. The thickness of the overlying unit 4 (Figure 5) varies significantly across the basin. It appears to reach almost 500 m in the east (where it is equivalent to the Moroak Sandstone) but thins to approximately 100 m in the west. This interval is mainly composed of shallow-water deposits in the east, which gradually transition to deeper-water deposits in the west. Two T-R cycles are recorded in unit 4. It is important to note that the transgressive parts are thinner compared to those in the underlying T-R cycles. The overlying unit 5 (equivalent to lower Kyalla, approximately 250 m; Figure 5) records a significant deepening of the depositional environments at its base, and at least one T-R cycle is apparent. It comprises shoreface deposits in the east (equivalent to the Elliott sandstone member) and turbidite deposits in the west. Unit 6 is up to 550 m thick and is truncated by a major erosional surface (Yang et al., 2020b). It mostly comprises deposits formed below the storm wave base, arranged in two T-R cycles.
The north-south section records a facies distribution similar to that of the east-west section (Figure 6). Unit 1 is intersected only in the north, where it records deposition below the storm wave base, with the rare occurrence of lower shoreface deposits. Comparable to the east-west cross section (Figure 5), two T-R cycles are developed in unit 1 and a carbonate-rich interval occurs at the top of the second cycle (Figure 6). Unit 2 also preserves the three T-R cycles observed on the east-west transect. In the central part of the basin (e.g., Kalala South 1), this unit records three high GR intervals. The thickness of unit 2 is variable, measuring more than 600 m in the south, and thinning to approximately 150 m in the north. It is important to note that the second and the third shale (B and C) merge in the northern part of the basin between Borrowdale 2 and Lady Penrhyn 1. Just as along the east-west section, unit 3 is characterized by the occurrence of turbidite deposits and two T-R cycles. Unit 4 records a facies shift from shallow-water deposits in the south to deep-water deposits in the north. The shallow-water deposits thin from 300 m in Elliott 1 to less than 50 m in McManus 1 (Figure 6). These observations are similar to those made along the east-west transect, which also demonstrates thinning and deepening from east to west (Figure 5). Unit 5 again records significant deepening across the study area; however, in contrast to the east-west section, two T-R cycles are preserved within this unit (Figure 6). The second cycle records a facies distribution similar to the one observed along the east-west transect, which we interpret as the Elliott sandstone member of the Kyalla Formation. Unit 6 comprises mostly offshore to lower shoreface deposits, arranged in two T-R cycles. This unit reflects an overall deepening of the depositional environment.
DISCUSSION
Stratigraphic Architecture
An understanding of the 2-D facies distribution along two transects allows us to relate the observed facies shifts to relative sea-level variations. This in turn allows us to reconstruct the stratigraphic architecture of the shale play. In the greater McArthur Basin, regional unconformities interpreted to have formed in response to major tectonic events bound the major sedimentary groups (Rawlings, 1999). These unconformities have previously been interpreted as first-order sequence boundaries (SBs; Kunzmann et al., 2020). In our case study, this means that the unconformities at the base and top of the Roper Group represent such first-order SBs. Lower-rank sequences are nested within this first-order sequence (Catuneanu, 2019b), and the identified sequences within the Velkerri, Moroak, and Kyalla Formations represent second and lower order sequences.
Second-Order Stratigraphic Evolution
Because the stratigraphic architecture results from the complex interplay between sediment supply and accommodation, not all systems’ tracts must be developed and preserved in all locations across a sedimentary basin (Catuneanu, 2006, 2019a). At the scale of the study (300–500 km), the second-order SBs will be expressed as unconformable contacts. In the Beetaloo Sub-basin (i.e., 60,000 km2) the Bessie Creek Sandstone is unconformably overlain by the Velkerri Formation (Munson, 2016). The boundary between the Moroak Sandstone and the Kyalla Formation is an unconformable surface in the east of the basin that becomes conformable in the west of the basin (Figure 5). The uppermost major unconformity in this study is the boundary between the deep-water facies of the Kyalla Formation and the shallow-water/continental facies of the overlying Jamison sandstone. This is the first-order SB developed at the top of the Roper Group, which is developed as an erosive surface from which several hundreds of meters of stratigraphy have been removed (Yang et al., 2020b). Considering the characteristics of these three surfaces, the one at the top of the Bessie Creek Sandstone is interpreted to be second order. The unconformity at the top of the Roper Group, being first order, will also bind a second-order sequence (Figures 7, 8), and the second-order sequence contained within the studied interval should include a major maximum flooding surface (MFS). In the Velkerri and Kyalla Formations, several intervals were deposited below the storm wave base; these are characterized by high GR values and represent potential MFSs. Among these deep-water deposits, unit 2 (A, B, and C shales from the Amungee Member) records a high organic content (Warren et al., 1998; Munson and Revie, 2018; Jarrett et al., 2019a). This could be attributed to organic matter concentration in sediment-starved environments being related to the increased distance from sediment sources (Passey et al., 2010) occurring at the maximum backstep of the sedimentary system. In detail, GR values are often higher in the C shale than in the A and B shales, the result of lower dilution of authigenic U by detrital particles (Crombez et al., 2020). This surface has a basin-wide extent, and we interpret it as a second-order MFS (Figures 7, 8). The underlying units 1 and 2 (Kalala and Amungee Members, up to the C shale) represent a second-order transgressive systems tract (TST), which is followed by a second-order regression spanning the interval from the C shale to the sub-Jamison unconformity. At this order, no downstepping is observable, indicating that the second-order regression recorded in units 3–6 (Wyworrie Member, Moroak Sandstone, and Kyalla Formation) is normal and represents a second-order highstand systems tract (HST). However, a second-order forced regression should not be excluded and could be present below the erosional surface at the base of the Jamison sandstone. In this second-order framework, the Jamison sandstone is interpreted as a lowstand systems tract (LST), being deposited in a continental (Gorter and Grey, 2012), or shallow-water setting (Munson, 2016), after a relative sea-level drop that resulted in the erosion of the top of the Kyalla Formation. In the studied interval, besides the Jamison sandstone, no LST is identified in any other order. In this case study, second-order SBs are expressed as a shift from “shallow-water” regressive deposits to “deep-water” transgressive units, and the SBs are stacked with the transgressive surfaces (TSs).
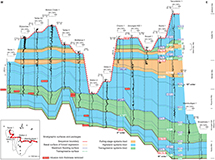 Figure 7. Stratigraphic architecture of the Velkerri-Kyalla interval along an east-west transect. Note on this figure that the colors represent the third-order systems tracts, and the stratigraphic lines’ strokes account for the different stratigraphic orders. BSFR = basal surface of forced regression; Fm. = Formation; FSST = falling stage systems tract; GR = gamma ray; HST = highstand systems tract; Mbr. = Member; MFS = maximum flooding surface; SB = sequence boundary; Sds. = Sandstone; TS = transgressive surface; TST = transgressive systems tract.
 Figure 8. Stratigraphic architecture of the Velkerri-Kyalla interval along a north-south transect. Note in this figure that the colors represent the third-order systems tracts, and the stratigraphic lines’ strokes account for the different stratigraphic orders. BSFR = basal surface of forced regression; Fm. = Formation; FSST = falling stage systems tract; GR = gamma ray; HST = highstand systems tract; Mbr. = Member; MFS = maximum flooding surface; SB = sequence boundary; Sds. = Sandstone; TS = transgressive surface; TST = transgressive systems tract.
Third-Order Stratigraphic Evolution
Within the second-order sequences, a higher frequency of cyclicity is observed in the Velkerri and Kyalla Formations and the Moroak Sandstone. Nested third-order sequences are bound by third-order SBs, as well as first- and second-order SBs already identified. Although second-order cyclicity implies basin-wide shoreline shifts, third-order SBs in the Beetaloo record shifts of a few tens of kilometers. This means that the third-order SBs are expected to gradually change expression across the basin. A potential third-order SB is the surface at the top of unit 1 (below the A shale). It represents a facies shift from strata deposited above the storm wave base to deep-water facies. Although this surface does not show evidence of erosion, its significant lateral extent (hundreds of kilometers) makes it a potential third-order SB. Higher in the stratigraphy, the surface at the transition between units 4 and 5 (approximately at the boundary between the Moroak Sandstone and the lower Kyalla Formation) reflects a significant vertical facies change and is potentially erosive in the southern and eastern parts of the study area. In addition, the surface at the top of unit 5 (Elliott sandstone member; Figures 5, 6) is likely unconformable in the south and east but transitions into a conformable surface toward the north and west. Because this surface also records an abrupt facies change in most parts of the basin, it is interpreted as a third-order SB. In summary, three third-order SBs were identified in the studied interval, in addition to the first- and second-order SBs previously identified bracketing four third-order sequences.
The oldest third-order sequence comprises two T-R cycles. Of these two cycles, the first often records a surface with the highest GR values within this sequence and is considered to be the corresponding first third-order MFS. No other sequence stratigraphic surface is identifiable in the available data set for this sequence; therefore, we divide this third-order sequence into an HST overlying a TST.
The second third-order sequence contains the second-order MFS that is also interpreted as a third-order sequence MFS. In the upper part of the sequence, the shallow-water deposits that constitute unit 4 (Moroak Sandstone) can be interpreted as being either a highstand normal regressive or a forced-regressive interval. In the case of a highstand normal regression, the rising relative sea level would generate accommodation on the margin of the basin, which would likely be filled by backshore and continental deposits. Neither our study nor previous work on the Moroak Sandstone (Powell et al., 1987; Munson, 2016) report such sedimentary environments, with the shallowest parts of unit 4 (Moroak Sandstone) being described as tidal flat deposits. The absence of continental deposits in the known extent of the Moroak Sandstone suggests that accommodation was not created at the basin margin. These observations are more compatible with a forced regression and downstepping of the shoreline (Catuneanu, 2006). A basal surface of forced regression is therefore interpreted at the base of unit 4 (Moroak Sandstone). It separates an HST present in unit 3 (above the C shale) and a falling stage systems tract present in unit 4 (Moroak Sandstone) from the top of the second third-order sequence (Figures 7, 8). Although the observed sedimentary environments are compatible with a forced regression, the absence of a significant erosion surface to the east and south of the basin suggests that the relative sea-level fall was of limited amplitude.
Above unit 4, the third sequence records two T-R trends. The second one appears poorly preserved along the eastern part of the basin (Figure 5). In this sequence, the deepest sedimentary environments are observed tens of meters above the base of the sequence and are interpreted as MFSs. Toward the south and east of the basin, the top of the sequence comprises shallow-water deposits that progressively transition into gravity flow deposits toward the west (equivalent to the Elliott sandstone member). In detail, the GR log often records a sharp drop, which reflects a sudden basinward shift of the shoreline (Catuneanu, 2019a). This is likely accompanied by the truncation of the underlying strata, which explains the poor preservation of the second T-R cycle in the eastern part of the basin (Figure 5). We interpret this sudden facies shift as forced regression, with its basal surface placed at the GR drop in the east and south and beneath the gravity flow deposits in the west. Alternatively, the unit 4 interval may be either a highstand or lowstand normal regression. However, this would imply that during the deposition of the sand-rich interval the relative sea level was slowly rising, favoring the accumulation of continental deposits on the edges of the basin. Since only marine facies were identified in the Elliott sandstone member, the highstand or lowstand normal regression interpretations seem unlikely.
The uppermost third-order sequence recorded in the studied interval is truncated by the first-order sub-Jamison SB. This sequence comprises two well-developed T-R cycles across the basin. In the southern and eastern parts of the basin, multiple prograding deposits occur that are difficult to identify in other parts of the basin. In the west, the GR log shows progressively increasing values, which we interpret as a fining-upward trend. Identifying an MFS is more challenging here than in the underlying third-order sequences. Because of the occurrence of multiple coarse-grained, prograding deposits in the upper part of this sequence, we interpret the MFS to be located at the top of the first deepening cycle. In this sequence only two systems’ tracts are identifiable—a TST and an HST.
In the third order, similarities exist with the stratigraphic architecture suggested by Abbott and Sweet (2000). Our basal SB (SB1) and the SB3 correspond to the base and top, respectively, of their “Veloak” sequence, whereas the SB3 and the topmost SB5, respectively, correspond to the base and top of their “Shermi” sequence. By adding more wells intersecting the Velkerri-Kyalla interval, we have been able to refine previous work on the stratigraphy of these formations and identify additional sequences previously not identified.
Fourth-Order Stratigraphic Evolution
The available facies and GR data permit the identification of high-frequency cyclicity nested within the third-order sequences of the Velkerri and Kyalla Formations and Moroak Sandstone. These cycles are between 100 m (in the west and north) and 250 m thick (in the south and east), and we interpret them as fourth-order sequences (Catuneanu, 2019b). Although identifiable, the available data do not allow the identification of stacking patterns necessary to divide the regressive part into lowstand, highstand, and forced-regressive deposits (sensu Hunt and Tucker, 1992 and Helland-Hansen and Gjelberg, 1994). Therefore, we use the framework proposed by Johnson and Murphy (1984), only distinguishing two surfaces: maximum regressive surfaces and MFSs. These surfaces are used to distinguish regressive systems tracts and TSTs. Twelve fourth-order sequences can be identified from our data set. In addition, a thick interval of turbidite deposits, most likely representing another fourth-order regressive event, suggest that a 13th T-R cycle may have occurred in unit 3 (Kalala Member). The identification of T-R cycles is in contrast to the recent findings by Cox et al. (2022), who suggested that organic matter enrichment was not related to MFS but solely to redox-controlled processes and primary productivity variations.
Chronostratigraphic Framework
Previous work on the Velkerri and Kyalla Formations and Moroak Sandstone provided several different age constraints for these units (Abbott et al., 2001; Kendall et al., 2009; Yang et al., 2018, 2019). Recently, Yang et al. (2018) suggested that the Velkerri Formation and the Moroak Sandstone were deposited between 1349 and 1320 Ma, whereas the Kyalla Formation must be younger than 1313 ± 47 Ma and older than the maximum depositional age of 959 ± 18 Ma of the overlying Jamison sandstone. Integrating these available age constraints into our sequence stratigraphic framework allows us to better understand the age and duration of the studied stratigraphic interval. Without integration, the available ages suggest high sedimentation rates for the Velkerri-Moroak interval; for example, 110 m⋅m.y.−1 for Tanumbirini 1 and 90 m⋅m.y.−1 for Amungee NW 1 (assuming the uncompacted thickness to have been 1.8 times higher than the current thickness; Fowler and Yang, 1998). Organic-rich rocks generally form under low sedimentation rates (−1; Tyson, 2001). The sedimentation rates in the Velkerri-Moroak interval are difficult to determine. On the one hand, given that the primary productivity in the Proterozoic was generally low (Crockford et al., 2018), the sedimentation rates in the Velkerri-Moroak interval could have been less than 50 m⋅m.y.−1. On the other hand, they may have been close to modern values, considering that individual Proterozoic basins are reported to have had higher organic matter burial rates (Hodgskiss et al., 2020).
By including the detrital zircon geochronology data from previous studies (Yang et al., 2018, 2019; Appendix Table 3 [supplementary material available as AAPG Datashare 171 at www.aapg.org/datashare]) into our stratigraphic architecture, we were able to construct a chronostratigraphic framework. We selected samples with a concordance of ≥95% between 206Pb/207Pb and 206Pb/238U ages. As recommended by Copeland (2020), we consider only the youngest zircon age to represent the maximum depositional age.
Of the 20 reported samples, only 5 present a maximum depositional age younger than the underlying strata. As shown in Figure 9, using Re-Os ages, only three samples are considered to provide significant insights into the depositional ages of the Velkerri and Kyalla Formations and the Moroak Sandstone. A zircon was analyzed from the Jamison sandstone that yielded a maximum depositional age of 1142 ± 47 Ma. This indicates that the underlying Kyalla Formation was likely deposited before ca. 1170 Ma. At the top of the Wyworrie Member, a zircon yielding a maximum depositional age of 1298 ± 47 Ma suggests that the transition from the Velkerri Formation to the Moroak Sandstone occurred at ca. 1300 Ma. Finally, a zircon from the Bessie Creek Sandstone yielded a maximum depositional age of 1409 ± 42 Ma, implying that the base of the Velkerri Formation is not older than ca. 1420 Ma. In addition to the selected detrital zircons, available Re-Os constraints from Kendall et al. (2009) collected from well Urapunga-4 to the north of the Beetaloo Sub-basin provide a Re-Os age of 1417 ± 29 Ma at the base of the Velkerri Formation, which is compatible with the interpreted depositional age of ca. 1420 Ma for the base of this interval. Another Re-Os age indicates an age of 1361 ± 21 Ma for the uppermost organic-rich interval of the Velkerri Formation. This is compatible with a maximum depositional age of 1300 Ma for the top of the Velkerri Formation.
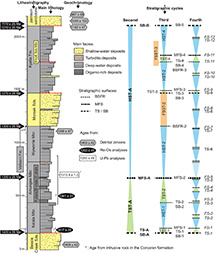 Figure 9. Lithostratigraphic, chronostratigraphic, and sequence stratigraphic framework of the studied interval (data from Abbott et al., 2001; Kendall et al., 2009; Yang et al., 2018, 2019). Note that this is a composite section based on wells Altree 1, McManus 1, and Elliott 1. The ages in the black arrows are interpreted from all of the available chronostratigraphic data. The ±25 Ma represents 10% of the Velkerri-Kyalla interval deposition. BSFR = basal surface of forced regression; Fm. = Formation; FS = flooding surface; FSST = falling stage systems tract; GR = gamma ray; HST = highstand systems tract; Mbr. = Member; MFS = maximum flooding surface; SB = sequence boundary; Sds. = Sandstone; TS = transgressive surface; TST = transgressive systems tract.
Previous work often refers to a U-Pb intrusive age to constrain the minimum depositional age for the Velkerri and Kyalla Formations. However, these ages are not used in the present study because they are derived from outcropping units, with poor constraints on their stratigraphic position, to the north of the study area (Abbott et al., 2001), or intrusive rocks located in the underlying strata (Bodorkos et al., 2020). Thus, they do not provide direct calibration of the depositional age of the units in the subsurface of the Beetaloo.
The geochronological framework indicates that the Velkerri Formation was deposited over approximately 120 m.y. This suggests an average duration of approximately 15 m.y. for each of the eight fourth-order T-R cycles. Assuming a similar duration for the cycles in the Moroak Sandstone and the Kyalla Formation gives an age of ca. 1270 Ma for the boundary between the Moroak Sandstone and Kyalla Formation, and an age of ca. 1210 Ma for the top of the Kyalla Formation. Using the presented chronostratigraphic framework, sedimentation rates computed for both the Velkerri Formation and Moroak Sandstone, respectively, are 21.26 m⋅m.y.−1 for Tanumbirini 1 and 17.4 m⋅m.y.−1 for Amungee NW 1. These sedimentation rates are consistent with values expected for Proterozoic organic-rich shales (−1). They are also within the same order of magnitude as a recent estimate of 40 m⋅m.y.−1 (postcompaction) for the Velkerri Formation based on Milankovitch cyclicity studies (Mitchell et al., 2020).
Our chronostratigraphic framework allows us to calculate the duration of sequences of different hierarchical ranks, assuming that the T-R cycles have a constant cyclicity. The second-order sequence represents a duration of at least 210 m.y., assuming 300 m of sediment were eroded at the top of the Kyalla Formation (Faiz et al., 2021), which represents approximately two T-R cycles. It places the end of the Kyalla deposition at ca. 1180 Ma. This is compatible with the youngest zircons analyzed in the lower Jamison sandstone (Figure 9). The third-order sequences span on average 52.5 m.y., with the second sequence recording the longest duration (105 m.y.) and the first sequence recording the shortest duration (30 m.y.). In summary, the fourth-order sequences in the studied stratigraphic interval are approximately 15 m.y. long, the third-order sequences are between 50 and 100 m.y. long, and the second-order sequences are at least 200 m.y. long. These sequence durations are systematically longer than the average ranges presented in a recent study on the cyclicity of the sedimentary records globally (300 yr–0.1 m.y. for fourth order, 10,000 yr–3 m.y. for third order, and 0.5–30 m.y. for second order; Catuneanu, 2019b). Since the data presented in Catuneanu (2019b) stem largely from Phanerozoic basins, this may indicate different controls on sequence formation in the mid-Proterozoic.
Erosion rates are controlled mainly by the uplift rates that control the slope (Schaller et al., 2001; Montgomery and Brandon, 2002) and the climate that will drive the expression of chemical and mechanical erosion processes (Summerfield and Hulton, 1994; Molnar, 2004; Jiongxin, 2005). At the time of deposition of the studied interval, the atmosphere and the biosphere were significantly different from those of the present day (Lyons et al., 2014), which suggests a different, poorly quantified control of climate on erosion rates. Present-day estimations of erosion rates show values of up to 10 mm⋅yr−1 (10,000 m⋅m.y.−1) and suggest a strong relationship between topography (Montgomery and Brandon, 2002) and the uplift rates (Cyr et al., 2010). In the Proterozoic, the topography around the basin was probably low because the closest mountain ranges were 250 km south of the basin (Yang et al., 2020a). Because of this low topography and the absence of land plants, we interpret the erosion rate to be in the lower part of the present-day range—less than 0.10 mm⋅yr−1 (100 m⋅m.y.−1). This suggests that the erosion at the top of the Kyalla Formation took place in a few million years, which agrees with the maximum depositional age determined from zircons found in samples from the lower Jamison sandstone.
Controls on Stratigraphic Evolution and Regional Implications
Sediment Sources and Links to Chemostratigraphy
The reconstructed facies distribution and stratigraphic architecture provide important information on the directions from which sediments were supplied. All of the units thin toward the north and west. In addition, shallow-water deposits are the predominant facies in the wells that intersect the southern and eastern parts of the Moroak Sandstone (e.g., Elliott 1, Tanumbirini 1) and pinch out toward the north and west (e.g., Tarlee S3). In the Elliott sandstone member of the Kyalla Formation, turbidite deposits occur in the western part of the basin and are interpreted to be temporally equivalent to the shallow-water deposits in the east (e.g., Tanumbirini 1). These observations indicate that the proximal part of the sedimentary system was located in the southeast and that the basin deepened to the northwest. Furthermore, no significant changes in sediment supply direction occurred during the deposition of the Velkerri to Kyalla Formations. This contrasts with the interpretation of Yang et al. (2020b), who suggested that sediments were partly delivered from the north.
Further constraints on sediment sources are provided by comparing the chemostratigraphic framework from Munday and Forbes (2020) with our stratigraphic architecture (Figure 10). A total of five chemosequences (S0–S4) were distinguished and have been further subdivided into chemopackages based on the variability of elemental composition. The relative elemental abundance is interpreted to reflect variations in sediment provenance and depositional processes, as well as the environment of deposition and diagenetic alteration.
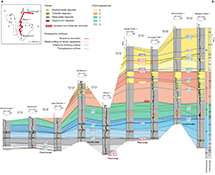 Figure 10. Stratigraphic and chemostratigraphic frameworks of the Velkerri and Kyalla Formations and Moroak Sandstone. The chemostratigraphic packages are derived from Munday and Forbes (2020). Note that the different colors relate to different chemosequences. GR = gamma ray; MFS = maximum flooding surface; TS = transgressive surface.
In the Velkerri Formation, the transition from the first to the second third-order sequence coincides with the transition from the first to the second chemosequence, which is interpreted as a distinct change in sediment provenance. The first sequence is characterized by relatively high Zr content, most likely caused by increased zircon abundance. The second sequence has more mafic characteristics, indicated by an increase in element ratios such as Ti:Nb and Ti:Th and is, in addition, enriched in P (Cox et al., 2016; Munday and Forbes, 2020). A potential source was located in the Mount Isa region (Yang et al., 2018). The second shift in geochemical composition is recorded above the C shale (Figure 10). This shift reflects a return to a more felsic source (Munday and Forbes, 2020) located to the east of the basin (Yang et al., 2019). The transition from the Amungee to the Wyworrie Member is characterized by a shift from relatively high Na concentrations to high K concentrations, reflecting a switch from plagioclase-dominant feldspars to potassium-rich feldspars, as well as a significant and sustained increases in Zr concentration. Here, the return to a more felsic source coincides with the end of the deposition of organic-rich units. Changes in elemental composition at the base of the Moroak Sandstone (S2–S3) are thought to represent a change in facies, from prodelta to delta front, rather than a change in sediment provenance. It is interpreted to be related to the occurrence of a third-order forced regression. The shift from chemosequence 3 to 4 is commonly marked by the occurrence of ironstone (Sherwin Member) on top of the Moroak Sandstone displaying Fe-rich lithologies. The overlying Kyalla Formation is characterized by its high Rb:Al ratio and coincides with a shift in detrital zircon provenance (Yang et al., 2019). The detrital zircon data were interpreted as indicative of a provenance shift from the east (e.g., Mount Isa region) to the south (e.g., Arunta region; Yang et al., 2019). However, detailed chemostratigraphic analyses highlighted numerous similarities between chemosequences 2 and 4 (Munday and Forbes, 2020), suggesting that this shift reflects a change in the depositional environments but maintains similar source compositions. Furthermore, the single chemosequence identified in the Kyalla Formation is consistent with the absence of a northern source region that would likely have had a different geochemical signature.
Chemopackage and chemosequence boundaries often coincide with surfaces of sequences of stratigraphic significance. This suggests that, at the scale of the study, the factors that controlled the sequence stratigraphic architecture also affected the chemostratigraphy. The good correlation between the interpreted sequence stratigraphy and chemostratigraphy in the basin corroborates that both data sets are complementary. Chemostratigraphic data are very powerful for reinforcing sequence stratigraphic interpretations in areas and intervals of lower confidence.
Structural Framework and Relative Sea-Level Variations
At present, the Daly Waters high (Figure 1) splits the subbasin into two depocenters (eastern and western) and was previously interpreted as a topographic high during the Proterozoic (Yang et al., 2020a). Stratigraphic observations from wells on either side of this structure (e.g., Tarlee S3, McManus 1) do not indicate significant thickness or facies variations during the deposition of units 2–6 (the Amungee and Wyworrie Members of the Velkerri Formation and the Moroak Sandstone and Kyalla Formation). This suggests that the Daly Waters high did not affect sediment dispersal and depositional environments at the time of deposition and only became a prominent structural feature in the basin after the deposition of the studied interval. However, this does not imply that there were earlier or later structural reorganizations along the Daly Waters high in the basin. A significant thickness variation between the Tarlee 1 and Birdum Creek 1 wells suggests that there was a local bathymetric high within the eastern depocenter during the deposition of the A, B, and C shales. Although the available data are not sufficient to accurately locate all of the small structural features, the thinning of unit 2 (equivalent to the Amungee Member) in Tarlee 1 suggests that local structural movements may have occurred within the two depocenters. Similar observations can be made in the northern part of the basin, where stratigraphic correlations, supported by chemostratigraphy (Munday and Forbes, 2020), indicate the stratigraphic pinch-out of the interval usually separating the B and C shales. The B and C shale intervals are juxtaposed in this area, which suggests the occurrence of a topographic high in the northern part of the basin. Considering its location, we refer to this topographic feature as the Urapunga arch. Although active between the deposition of the B and C shales, it probably existed before the deposition of the A shale and remained present until after the deposition of the C shale. The location of this structural high may be important for the accumulation of organic-rich strata in the Velkerri Formation. Although recent work has emphasized the role of primary productivity over basin restriction (Cox et al., 2019), this topographic high occurs over an area where it could have separated the Beetaloo Sub-basin from the ocean between Laurentia and the NAC. Therefore, the Urapunga arch may have restricted the water renewal of the basin, favoring the development of anoxic environments. This structural high may have hampered the nutrient supply by upwelling, implying that another driver for the increased productivity observed in the A–C shales is required. This highlights the importance of rivers to deliver the nutrients sourced from the mafic rocks located to the south of the basin (Yang et al., 2019).
In the Velkerri and Kyalla Formations and the Moroak Sandstone, the fourth-order T-R cycles (Figure 11C) present a regular periodicity. This rhythmicity suggests that these were likely controlled by eustatic variation. The interpretation of medium-term eustatic variations in this Mesoproterozoic interval aligns with the results from Mitchell et al. (2020), who highlighted short-term eustatic variations in the lower part of the studied interval.
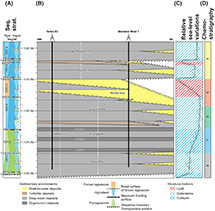 Figure 11. Wheeler diagram showing sequence stratigraphic (Seq. Strat.) architecture (A), the distribution of the sedimentary facies in the Velkerri, Moroak, and Kyalla Formations (B), the variation of the relative sea level (C), and chemosequences (D) (chemosequences derived from Munday and Forbes, 2020). BSFR = basal surface of forced regression; Fm. = Formation; fs = flooding surface; FSST = falling stage systems tract; HST = highstand systems tract; Mbr. = Member; MFS = maximum flooding surface; SB = sequence boundary; Sds. = Sandstone; TS = transgressive surface; TST = transgressive systems tract.
Unlike the fourth-order cycles, the third-order sequences have different periods (from 30 to 105 m.y.), which may suggest that they were controlled by irregular, regional, structural processes. Within the Velkerri and Kyalla Formations and the Moroak Sandstone, four intervals are interpreted as third-order transgressions (Figure 11A) related to rapid relative sea-level rise events. They show a sudden deepening of the sedimentary environment, with three recording a shift from subaerial unconformities to deep-water deposits (the bases of the Velkerri, the lower Kyalla, and the upper Kyalla Formations; Figure 11B). We interpret the pace and amplitude of these changes to reflect rapid, structurally controlled subsidence (Figure 11C). In addition to the third-order transgressions, four regressive intervals are recorded within the studied interval (Figure 11A). Here, the regressive parts of sequences 1 and 4 only record highstand deposition, whereas sequences 2 and 3 record both highstand deposition and forced regression. We interpret third-order HSTs to have been deposited during phases of regional subsidence when sediment supply exceeded accommodation, and FSSTs to reflect large-scale basin uplift (Figure 11C).
When placed into a broader geodynamic context, the Velkerri and Kyalla Formations and the Moroak Sandstone are interpreted to have been deposited during the closing of the Mirning ocean, separating the West Australian craton and the NAC, and associated with subduction-related magmatism and orogeny located a couple of hundred kilometers to the south of the Beetaloo Sub-basin (Yang et al., 2019). The different basin-scale, uplift, and subsidence phases observed in the Beetaloo Sub-basin can therefore likely be tied to the motions of the different cratons located around the basin. Indeed, craton accretions and variations in subduction speed will affect the stress regime and control the vertical motion of the area (Rohais et al., 2018). Two phases of uplift are recorded during the deposition of the Moroak Sandstone (ca. 1270 Ma) and the Elliott sandstone member of the Kyalla Formation (ca. 1245 Ma) and precede the development of a major unconformity at the base of the Jamison sandstone (ca. 1170 Ma). The interpreted ages for each of these uplifts and resulting erosion events match the ages proposed by Smits et al. (2014) for the accretion of the West, North, and South Australian cratons. They showed that cratons did not accrete before 1200 Ma, which suggests that the uplift event recorded by the sub-Jamison unconformity happened after the deposition of the Kyalla Formation and may record the cratons’ accretions. This observation could also indicate that the uplift events present in the studied interval are related to the variation of the subduction velocity toward the south-southwestern edge of the NAC.
Paleogeographic Evolution
The top of the Bessie Creek Sandstone is marked by a TS of erosion likely replacing a subaerial unconformity that separates shallow-water facies below from the deep-water facies of unit 1 (Kalala Member; Figure 12A). On maps in Figure 12, the location of the highland is derived mainly from the location of the potential sedimentary sources suggested by Yang et al. (2018). We interpret the majority of the basin to have been mostly continental at the top of the Bessie Creek Sandstone (Figure 12A; this continental top has been eroded by the basal Velkerri transgression), transitioning into shallow marine and eventually offshore facies to the north of the study area. These deeper-water deposits are postulated to reflect the transition into an open ocean that lies farther to the north (Yang et al., 2018). The strata overlying this surface are interpreted to record a transgression during the deposition of units 1 and 2 (the Kalala and Amungee Members; Figure 12B), in which the A, B, and C shales reflect intervals of maximum shoreline backstepping. At the end of the transgression, the shoreline is interpreted to have shifted significantly toward the south, close to the Tennant Creek and Arunta provinces.
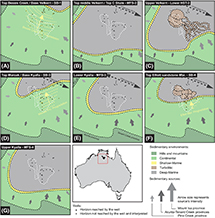 Figure 12. Schematic paleogeographic evolution during the deposition of the Velkerri and Kyalla Formations and the Moroak Sandstone: (A) sequence boundary (SB)-1, (B) maximum flooding surface (MFS)-2, (C) lower highstand systems tract (HST)-2, (D) SB-3, (E) MFS-3, (F) SB-4, (G) MFS-4. The dotted lines separating the different sedimentary environments reflect the uncertainties of these interpretations. It is important to note that the facies distribution outside the wells’ vicinity is speculative and based on previous works on regional geodynamic interpretations (e.g., Yang et al., 2018). Fm. = Formation; Mbr. = Member.
Constraints determined from detrital zircons (Yang et al., 2019) and chemostratigraphy show that this transgression was not associated with a shift in provenance (Figure 11D). Following this transgression, a turbidite system with deposition toward the northwest was established, most likely confined by the Urapunga arch to the north (Figure 12C). The next significant step in the evolution of the basin was the northwestward progradation of the shallow marine facies of the Moroak Sandstone (Figure 12D). The base of the turbiditic interval and the base of the Moroak Sandstone are marked by a change in chemosequence (Figure 11D) (Munday and Forbes, 2020). This change is not synchronous with the structural reorganization observed in the extent of the basin. However, the sudden occurrence of gravity flow deposits suggests the reorganization of continental drainage systems far outside the study area; these are interpreted to be related to the closure of the Mirning ocean.
The base of the Kyalla Formation is marked by another second-order transgression (Figure 12E). However, we interpret this to have been associated with a less significant shoreline backstepping than the second-order transgression that led to the deposition of the A, B, and C shales of the Amungee Member. Indeed, core descriptions (Figure 4) show shallower facies in the lower Kyalla Formation, and chemostratigraphic analyses highlight similarities between chemosequences 2 and 4, which can be interpreted as derived from the same sedimentary environments (Figure 11D; Munday and Forbes, 2020). The organic content in the lower Kyalla Formation is moderately high, suggesting that the Urapunga arch still existed during the deposition of this interval. The Urapunga arch would have provided ideal conditions for the development of a silled basin enabling organic matter to accumulate. Overlying the lower Kyalla Formation, the Elliot Member reflects regression, with shallow-water deposits prograding from the southeast toward the northwest, progressively transitioning into gravity flow deposits (Figure 12F). The accumulation of turbidite deposits on the shelf suggests that the Urapunga arch was still present, preventing gravity flows from transiting into open ocean settings. The overlying strata, up to the sub-Jamison unconformity, record a transgression with the second-largest backstep of the shoreline observed in this study (Figure 12G). We postulate the shoreline to have shifted almost as far south as during the deposition of the C shale.
CONCLUSION
A detailed understanding of the stratigraphic architecture and facies heterogeneities in shale plays is important for reducing the risks and costs associated with exploration. Based on core descriptions, GR interpretations, and well correlations, this study reconstructed the stratigraphic evolution of the Mesoproterozoic Velkerri-Kyalla Formation interval in the Beetaloo Sub-basin. This study shows the following.
1. The studied interval is composed mostly of sedimentary rocks that were deposited in wave-dominated, fluvial-influenced marine environments ranging from foreshore to offshore, including gravity flow deposits and delta front facies.
2. Four main GR facies can be distinguished by upscaling core descriptions into GR log signatures. These include shallow-water deposits, shoreface to offshore deposits, turbidite deposits, and organic-rich deposits.
3. The studied interval is composed of one second-order depositional sequence, four third-order depositional sequences, and 13 fourth-order T-R cycles.
4. Stratigraphic sequences and chemosequences are linked in the Beetaloo Sub-basin. These approaches appear to be complementary, and all of the chemosequence changes occur across the surfaces of sequences of stratigraphic significance.
5. Sediments in the Beetaloo Sub-basin were likely supplied from the southeast during the deposition of the Velkerri and Kyalla Formations and the Moroak Sandstone.
6. Integrating previously published geochronology with our stratigraphic architecture produces findings that suggest that the Velkerri Formation was likely deposited between 1420 and 1300 Ma, the Moroak Sandstone between 1300 and 1270 Ma, and the Kyalla Formation between 1270 and 1210 Ma.
7. The Daly Waters high, presently the main structural feature in the Beetaloo Sub-basin, did not affect the sediment dispersal during the deposition of the Velkerri-Kyalla interval.
8. Small structural highs likely existed in the Beetaloo Sub-basin. For instance, a high that we have named the Urupunga arch existed in the northern part of the basin. It may have acted as a sill, limiting the water exchange between the basin and the open ocean.
9. The studied stratigraphic interval records three phases of uplift. They are interpreted to be related to the continental geodynamic evolution of the area and reflect the progressive closure of the Mirning ocean located to the south of the Beetaloo Sub-basin.
This work can be used as a foundation for detailed studies focusing on the paleoenvironmental, mineralogical, petrophysical, and mechanical variations in the Beetaloo Sub-basin. Moreover, by identifying the controls on the basin’s stratigraphic architecture, the findings of this study enable predictive models to be built. These models can be used to predict the distribution of sedimentary heterogeneities likely to generate hydrocarbons and provide favorable conditions for hydraulic stimulation.
REFERENCES CITED
Abbott, S. T., and I. P. Sweet, 2000, Tectonic control on third-order sequences in a siliciclastic ramp-style basin: An example from the Roper Superbasin (Mesoproterozoic), northern Australia: Australian Journal of Earth Sciences, v. 47, no. 3, p. 637–657, doi:10.1046/j.1440-0952.2000.00795.x.
Abbott, S. T., I. P. Sweet, K. A. Plumb, D. N. Young, A. Cutovinos, P. A. Ferenczi, A. Brakel, and B. A. Pietsch, 2001, Roper region: Urapunga and Roper River special, Northern Territory, 2nd ed.: Darwin, Northern Territory, Australia, Northern Territory Geological Survey Geological Map Series Explanatory Notes, Sheets SD 53-10 and SD53-11, scale 1:250,000, 2 sheets.
Ahmad, M., J. N. Dunster, T. J. Munson, and C. J. Edgoose, 2013, Overview of the geology and mineral and petroleum resources of the McArthur Basin, NT, in T. J. Munson and K. J. Johnston, eds., Annual Geoscience Exploration Seminar 2013, Alice Springs, Northern Territory, Australia, March 19–20, 2013, p. 55–61.
Ainsworth, R. B., B. K. Vakarelov, and R. A. Nanson, 2011, Dynamic spatial and temporal prediction of changes in depositional processes on clastic shorelines: Toward improved subsurface uncertainty reduction and management: AAPG Bulletin, v. 95, no. 2, p. 267–297, doi:10.1306/06301010036.
Angulo, S., and L. A. Buatois, 2012, Integrating depositional models, ichnology, and sequence stratigraphy in reservoir characterization: The middle member of the Devonian-Carboniferous Bakken Formation of subsurface southeastern Saskatchewan revisited: AAPG Bulletin, v. 96, no. 6, p. 1017–1043, doi:10.1306/11021111045.
Bhattacharya, J., and R. G. Walker, 1992, Deltas, in R. G. Walker and N. P. James, eds., Facies models. Response to sea level change: St. John’s, Newfoundland, Canada, Geological Association of Canada, p. 157–177.
Blaikie, T. N., and M. Kunzmann, 2020, Geophysical interpretation and tectonic synthesis of the Proterozoic southern McArthur Basin, northern Australia: Precambrian Research, v. 343, 105728, 23 p., doi:10.1016/j.precamres.2020.105728.
Bodorkos, S., J. L. Crowley, J. C. Claoué-Long, J. R. Anderson, and C. W. Magee, 2020, Precise U–Pb baddeleyite dating of the Derim Derim Dolerite, McArthur Basin, Northern Territory: Old and new SHRIMP and ID-TIMS constraints: Australian Journal of Earth Sciences, v. 68, no. 1, p. 36–50, doi:10.1080/08120099.2020.1749929.
Borcovsky, D., S. Egenhoff, N. Fishman, J. Maletz, A. Boehlke, and H. Lowers, 2017, Sedimentology, facies architecture, and sequence stratigraphy of a Mississippian black mudstone succession—The upper member of the Bakken Formation: North Dakota, United States: AAPG Bulletin, v. 101, no. 10, p. 1625–1673, doi:10.1306/01111715183.
Bouma, A. H., 1964, Turbidites, in A. H. Bouma and A. Brouwer, eds., Turbidites: Amsterdam, Elsevier, Developments in Sedimentology 3, p. 247–256, doi:10.1016/S0070-4571(08)70967-1.
Bruce, A., and D. Garrad, 2021, Unlocking the eastern extension of the Beetaloo Sub-basin middle Velkerri shales: Annual Geoscience Exploration Seminar 2021, Alice Springs, Northern Territory, Australia, April 20–21, 2021, p. 37–42.
Byun, U. H., H. S. Lee, and Y. K. Kwon, 2018, Sequence stratigraphy in the middle Ordovician shale successions, mid-east Korea: Stratigraphic variations and preservation potential of organic matter within a sequence stratigraphic framework: Journal of Asian Earth Sciences, v. 152, p. 116–131, doi:10.1016/j.jseaes.2017.11.028.
Catuneanu, O., 2006, Principles of sequence stratigraphy, 1st ed.: New York, Elsevier, 388 p.
Catuneanu, O., 2019a, Model-independent sequence stratigraphy: Earth-Science Reviews, v. 188, p. 312–388, doi:10.1016/j.earscirev.2018.09.017.
Catuneanu, O., 2019b, Scale in sequence stratigraphy: Marine and Petroleum Geology, v. 106, p. 128–159, doi:10.1016/j.marpetgeo.2019.04.026.
Catuneanu, O., V. Abreu, J. P. Bhattacharya, M. D. Blum, R. W. Dalrymple, P. G. Eriksson, C. R. Fielding, W. L. Fisher, , 2009, Towards the standardization of sequence stratigraphy: Earth-Science Reviews, v. 92, no. 1–2, p. 1–33, doi:10.1016/j.earscirev.2008.10.003.
Catuneanu, O., J. P. Bhattacharya, M. D. Blum, R. W. Dalrymple, P. G. Eriksson, C. R. Fielding, W. L. Fisher, , 2010, Thematic set: Sequence stratigraphy: Common ground after three decades of development: First Break, v. 28, no. 1717, p. 21–34, doi:10.3997/1365-2397.2010002.
Catuneanu, O., W. E. Galloway, C. G. S. C. Kendall, A. D. Miall, H. W. Posarnentier, A. Strasser, and M. E. Tucker, 2011, Sequence stratigraphy: Methodology and nomenclature: Newsletters on Stratigraphy, v. 44, no. 3, p. 173–245, doi:10.1127/0078-0421/2011/0011.
Chemostrat Australia, 2014, Release of Hess Corporation’s elemental data for 6 wells in the Beetaloo Basin, accessed January 1, 2019, https://geoscience.nt.gov.au/gemis/ntgsjspui/handle/1/85022.
Chemostrat Australia, 2016, Release of Chemostrat Pty Ltd. chemostratigraphy data for 3 wells in the McArthur Basin, accessed January 1, 2019, https://geoscience.nt.gov.au/gemis/ntgsjspui/handle/1/85067.
Close, D., 2014, The McArthur Basin: NTGS’ approach to a frontier petroleum basin with known base metal prospectivity: Annual Geoscience Exploration Seminar 2014, Alice Springs, Northern Territory, Australia, March 18–19, 2014, p. 85–89.
Close, D. I., A. J. Côté, E. T. Baruch, C. M. Altmann, F. M. Mohinudeen, B. Richards, and R. Ilett, 2017, Proterozoic shale gas plays in the Beetaloo Basin and the Amungee NW-1H discovery: Annual Geoscience Exploration Seminar 2017, Alice Springs, Northern Territory, Australia, March 28–29, 2017, 7 p.
Copeland, P., 2020, On the use of geochronology of detrital grains in determining the time of deposition of clastic sedimentary strata: Basin Research, v. 32, no. 6, p. 1532–1546, doi:10.1111/bre.12441.
Cox, G. M., A. S. Collins, A. J. M. Jarrett, M. L. Blades, A. V. Shannon, B. Yang, J. Farkas, , 2022, A very unconventional hydrocarbon play: The Mesoproterozoic Velkerri Formation of northern Australia: AAPG Bulletin, v. 106, no. 6, p. 1213–1237, doi:10.1306/12162120148.
Cox, G. M., A. Jarrett, D. Edwards, P. W. Crockford, G. P. Halverson, A. S. Collins, A. Poirier, and Z. X. Li, 2016, Basin redox and primary productivity within the Mesoproterozoic Roper Seaway: Chemical Geology, v. 440, p. 101–114, doi:10.1016/j.chemgeo.2016.06.025.
Cox, G. M., P. Sansjofre, M. L. Blades, J. Farkas, and A. S. Collins, 2019, Dynamic interaction between basin redox and the biogeochemical nitrogen cycle in an unconventional Proterozoic petroleum system: Scientific Reports, v. 9, no. 1, 5200, 11 p., doi:10.1038/s41598-019-40783-4.
Craig, J., U. Biffi, R. F. Galimberti, K. A. R. Ghori, J. D. Gorter, N. Hakhoo, D. P. Le Heron, J. Thurow, and M. Vecoli, 2013, The palaeobiology and geochemistry of Precambrian hydrocarbon source rocks: Marine and Petroleum Geology, v. 40, p. 1–47, doi:10.1016/j.marpetgeo.2012.09.011.
Crockford, P. W., J. A. Hayles, H. Bao, N. J. Planavsky, A. Bekker, P. W. Fralick, G. P. Halverson, T. H. Bui, Y. Peng, and B. A. Wing, 2018, Triple oxygen isotope evidence for limited mid-Proterozoic primary productivity: Nature, v. 559, no. 7715, p. 613–616, doi:10.1038/s41586-018-0349-y.
Crombez, V., S. Rohais, F. Baudin, B. Chauveau, T. Euzen, and D. Granjeon, 2017, Controlling factors on source rock development: Implications from 3D stratigraphic modeling of Triassic deposits in the Western Canada Sedimentary Basin: Bulletin de la Société Géologique de France, v. 188, no. 5, 30, 18 p., doi:10.1051/bsgf/2017188.
Crombez, V., S. Rohais, F. Baudin, and T. Euzen, 2016, Facies, well-log patterns, geometries and sequence stratigraphy of a wave-dominated margin: Insight from the Montney Formation (Alberta, British Columbia, Canada): Bulletin of Canadian Petroleum Geology, v. 64, no. 4, p. 516–537, doi:10.2113/gscpgbull.64.4.516.
Crombez, V., S. Rohais, F. Baudin, T. Euzen, J. P. Zonneveld, and M. Power, 2019, 3D stratigraphic architecture, sedimentary budget, and sources of the lower and middle Triassic strata of western Canada: Evidence for a major basin structural reorganization: Petroleum Geoscience, v. 26, no. 3, p. 462–479, doi:10.1144/petgeo2019-024.
Crombez, V., S. Rohais, T. Euzen, L. Riquier, F. Baudin, and E. Hernández Bilbao, 2020, Trace metal elements as paleoenvironmental proxies: Why should we account for sedimentation rates variations?: Geology, v. 48, no. 8, p. 839–843, doi:10.1130/G47150.1.
Cyr, A. J., D. E. Granger, V. Olivetti, and P. Molin, 2010, Quantifying rock uplift rates using channel steepness and cosmogenic nuclide-determined erosion rates: Examples from northern and southern Italy: Lithosphere, v. 2, no. 3, p. 188–198, doi:10.1130/L96.1.
de Vries, S. T., L. L. Pryer, and N. Fry, 2008, Evolution of Neoarchaean and Proterozoic basins of Australia: Precambrian Research, v. 166, no. 1–4, p. 39–53, doi:10.1016/j.precamres.2008.01.005.
Donnelly, T. H., and I. H. Crick, 1988, Depositional environment of the middle proterozoic Velkerri formation in northern Australia: Geochemical evidence: Precambrian Research, v. 42, no. 1–2, p. 165–172, doi:10.1016/0301-9268(88)90015-0.
Dumas, S., and R. W. C. Arnott, 2006, Origin of hummocky and swaley cross-stratification—The controlling influence of unidirectional current strength and aggradation rate: Geology, v. 34, no. 12, p. 1073–1076, doi:10.1130/G22930A.1.
Faiz, M., V. Crombez, C. Delle Piane, N. Lupton, M. Camilleri, and L. Langhi, 2021, Petroleum systems model for source-rock-reservoir evaluation in the Beetaloo Sub-basin, 3rd Australasian Exploration Geoscience Conference, Brisbane, Queensland, Australia, September 15–17, 2021, 6 p.
Fowler, A. C., and X. S. Yang, 1998, Fast and slow compaction in sedimentary basins: SIAM Journal on Applied Mathematics, v. 59, no. 1, p. 365–385, doi:10.1137/S0036139996287370.
Frogtech Geoscience, 2018, SEEBASE study and GIS for greater McArthur Basin, accessed January 1, 2019, https://geoscience.nt.gov.au/gemis/ntgsjspui/handle/1/87062.
Gorter, J., and K. Grey, 2012, Velkerri Formation depositional model - Beetaloo Sub-basin, Northern Territory, Australia: Biostratigraphy and organic enrichment: Central Australian Basins Symposium III, Alice Springs, Northern Territory, Australia, July 16–17, 2012, 6 p.
Helland-Hansen, W., and J. G. Gjelberg, 1994, Conceptual basis and variability in sequence stratigraphy: A different perspective: Sedimentary Geology, v. 92, no. 1–2, p. 31–52, doi:10.1016/0037-0738(94)90053-1.
Helland-Hansen, W., and G. J. Hampson, 2009, Trajectory analysis: Concepts and applications: Basin Research, v. 21, no. 5, p. 454–483, doi:10.1111/j.1365-2117.2009.00425.x.
Helland-Hansen, W., and O. J. Martinsen, 1996, Shoreline trajectories and sequences; Description of variable depositional-dip scenarios: Journal of Sedimentary Research, v. 66, no. 4, p. 670–688, doi:10.1306/D42683DD-2B26-11D7-8648000102C1865D.
Hodgskiss, M. S. W., P. Sansjofre, M. Kunzmann, E. A. Sperling, D. B. Cole, P. W. Crockford, T. M. Gibson, and G. P. Halverson, 2020, A high-TOC shale in a low productivity world: The late Mesoproterozoic Arctic Bay Formation, Nunavut: Earth and Planetary Science Letters, v. 544, 116384, 13 p., doi:10.1016/j.epsl.2020.116384.
Hoffman, T. W., 2015, Recent drilling results provide new insights into the western Palaeoproterozoic to Mesoproterozoic McArthur Basin: Annual Geoscience Exploration Seminar 2015, Alice Springs, Northern Territory, Australia, March 17–18, 2015, p. 50–55.
Hunt, D., and M. E. Tucker, 1992, Stranded parasequences and the forced regressive wedge systems tract: Deposition during base-level fall—Reply: Sedimentary Geology, v. 95, no. 1–2, p. 147–160, doi:10.1016/0037-0738(94)00123-C.
Jackson, M. J., M. D. Muir, and K. A. Plumb, 1987, Geology of the southern McArthur Basin, Northern Territory: Canberra, Australian Capital Territory, Australia, Australian Government Publishing Service, Bureau of Mineral Resources, Geology & Geophysics Bulletin 220, 315 p.
Jackson, M. J., P. N. Southgate, and R. W. Page, 2000, Gamma-ray logs and U-Pb zircon geochronology—Essential tools to constrain lithofacies interpretation of Paleoproterozoic depositional systems, in N. James and J. P. Grotzinger, eds., Carbonate sedimentation and diagenesis in the evolving Precambrian world: Tulsa, Oklahoma, SEPM Special Publication 67, p. 23–42.
Jackson, J., I. P. Sweet, and T. G. Powell, 1988, Studies on petroleum geology and geochemistry, Middle Proterozoic, McArthur Basin northern Australia I: Petroleum potential: The APPEA Journal, v. 28, no. 1, p. 283–302, doi:10.1071/AJ87022.
Jarrett, A. J. M., G. M. Cox, J. J. Brocks, E. Grosjean, C. J. Boreham, and D. S. Edwards, 2019a, Microbial assemblage and palaeoenvironmental reconstruction of the 1.38 Ga Velkerri Formation, McArthur Basin, northern Australia: Geobiology, v. 17, no. 4, p. 360–380, doi:10.1111/gbi.12331.
Jarrett, A. J. M., S. MacFarlane, T. Palu, C. Boreham, L. Hall, D. Edwards, G. Cox, , 2019b, Source rock geochemistry and petroleum systems of the greater McArthur Basin and links to other northern Australian Proterozoic basins: Annual Geoscience Exploration Seminar 2019, Alice Springs, Northern Territory, Australia, March 19–20, 2019, p. 92–105.
Jiongxin, X., 2005, Precipitation-vegetation coupling and its influence on erosion on the Loess Plateau, China: Catena, v. 64, no. 1, p. 103–116, doi:10.1016/j.catena.2005.07.004.
Johnson, J. G., and M. A. Murphy, 1984, Time-rock model for Siluro-Devonian continental shelf, western United States: GSA Bulletin, v. 95, no. 11, p. 1349–1359, doi:10.1130/0016-7606(1984)95<1349:TMFSCS>2.0.CO;2.
Kendall, B., R. A. Creaser, G. W. Gordon, and A. D. Anbar, 2009, Re-Os and Mo isotope systematics of black shales from the Middle Proterozoic Velkerri and Wollogorang Formations, McArthur Basin, northern Australia: Geochimica et Cosmochimica Acta, v. 73, no. 9, p. 2534–2558, doi:10.1016/j.gca.2009.02.013.
Kietzmann, D. A., R. M. Palma, A. C. Riccardi, J. Martín-Chivelet, and J. López-Gómez, 2014, Sedimentology and sequence stratigraphy of a Tithonian-Valanginian carbonate ramp (Vaca Muerta Formation): A misunderstood exceptional source rock in the southern Mendoza area of the Neuquén Basin, Argentina: Sedimentary Geology, v. 302, p. 64–86, doi:10.1016/j.sedgeo.2014.01.002.
Knapp, L. J., N. B. Harris, and J. M. McMillan, 2019, A sequence stratigraphic model for the organic-rich Upper Devonian Duvernay Formation, Alberta, Canada: Sedimentary Geology, v. 387, p. 152–181, doi:10.1016/j.sedgeo.2019.04.008.
Kohl, D., R. Slingerland, M. Arthur, R. Bracht, and T. Engelder, 2014, Sequence stratigraphy and depositional environments of the Shamokin (Union Springs) Member, Marcellus Formation, and associated strata in the middle Appalachian Basin: AAPG Bulletin, v. 98, no. 3, p. 483–513, doi:10.1306/08231312124.
Kunzmann, M., V. Crombez, T. N. Blaikie, O. Catuneanu, R. King, G. P. Halverson, S. Schmid, and S. Spinks, 2022, Sequence stratigraphy of the ca 1640 Ma Barney Creek Formation, McArthur Basin, Australia: Australian Journal of Earth Sciences, doi:10.1080/08120099.2022.2095030.
Kunzmann, M., V. Crombez, O. Catuneanu, T. N. Blaikie, G. Barth, and A. S. Collins, 2020, Sequence stratigraphy of the ca. 1730 Ma Wollogorang Formation, McArthur Basin, Australia: Marine and Petroleum Geology, v. 116, 104297, 21 p., doi:10.1016/j.marpetgeo.2020.104297.
Kunzmann, M., S. Schmid, T. N. Blaikie, and G. P. Halverson, 2019, Facies analysis, sequence stratigraphy, and carbon isotope chemostratigraphy of a classic Zn-Pb host succession: The Proterozoic middle McArthur Group, McArthur Basin, Australia: Ore Geology Reviews, v. 106, p. 150–175, doi:10.1016/j.oregeorev.2019.01.011.
Lanigan, K., S. Hibbird, S. Menpes, and J. Torkington, 1994, Petroleum exploration in the Proterozoic Beetaloo Sub-Basin, Northern Territory: The APPEA Journal, v. 34, no. 1, p. 674–691, doi:10.1071/AJ93050.
Lindsay, J. F., 2001, Basin dynamics and mineralisation, McArthur Basin, northern Australia: Australian Journal of Earth Sciences, v. 48, no. 5, p. 703–720, doi:10.1046/j.1440-0952.2001.00892.x.
Lyons, T. W., C. T. Reinhard, and N. J. Planavsky, 2014, The rise of oxygen in Earth’s early ocean and atmosphere: Nature, v. 506, p. 307–315, doi:10.1038/nature13068.
Macquaker, J. H. S., S. J. Bentley, and K. M. Bohacs, 2010, Wave-enhanced sediment-gravity flows and mud dispersal across continental shelves: Reappraising sediment transport processes operating in ancient mudstone successions: Geology, v. 38, no. 10, p. 947–950, doi:10.1130/G31093.1.
Meert, J. G., and M. Santosh, 2017, The Columbia supercontinent revisited: Gondwana Research, v. 50, p. 67–83, doi:10.1016/j.gr.2017.04.011.
Mitchell, R. N., U. Kirscher, M. Kunzmann, Y. Liu, and G. M. Cox, 2020, Gulf of Nuna: Astrochronologic correlation of a Mesoproterozoic oceanic euxinic event: Geology, v. 49, no. 1, p. 25–29, doi:10.1130/G47587.1.
Molnar, P., 2004, Late Cenozoic increase in accumulation rates of terrestrial sediment: How might climate change have affected erosion rates?: Annual Review of Earth and Planetary Sciences, v. 32, no. 1, p. 67–89, doi:10.1146/annurev.earth.32.091003.143456.
Montgomery, D. R., and M. T. Brandon, 2002, Topographic controls on erosion rates in tectonically active mountain ranges: Earth and Planetary Science Letters, v. 201, no. 3–4, p. 481–489, doi:10.1016/S0012-821X(02)00725-2.
Mulder, J. A., J. A. Halpin, and N. R. Daczko, 2015, Mesoproterozoic Tasmania: Witness to the east Antarctica-Laurentia connection within Nuna: Geology, v. 43, no. 9, p. 759–762, doi:10.1130/G36850.1.
Munday, S., and A. Forbes, 2020, Chemostratigraphy in the Beetaloo Basin (abs.): Sub20, Perth, Australia, February 12–13, 2020, 1 p.
Munday, S., 2020, Application of a shale evaluation workflow in the Velkerri Fm, Beetaloo Basin: Petroleum Exploration Society of Australia Webinar, July 1, 2020, accessed August 17, 2023, https://www.knowledgette.com/p/application-of-a-shale-evaluation-workflow-in-the-velkerri-fm-beetaloo-basin.
Munson, T. J., 2016, Sedimentary characterisation of the Wilton package, greater McArthur Basin: Northern Territory: Darwin, Northern Territory, Australia, Northern Territory Geological Survey, 157 p.
Munson, T. J., and D. Revie, 2018, Stratigraphic subdivision of the Velkerri Formation, Roper Group, McArthur Basin, Northern Territory: Darwin, Northern Territory, Australia, Northern Territory Geological Survey Record 2018-006, 31 p.
Myers, J. S., R. D. Shaw, and I. M. Tyler, 1996, Tectonic evolution of Proterozoic Australia: Tectonics, v. 15, no. 6, p. 1431–1446, doi:10.1029/96TC02356.
Origin Energy Resources, 2015a, Amungee NW-1 well completion report (basic), EP 98, Beetaloo Basin, Northern Territory, accessed January 1, 2019, https://geoscience.nt.gov.au/gemis/ntgsjspui/handle/1/86845.
Origin Energy Resources, 2015b, Kalala S-1 well completion report (basic), EP 98, Beetaloo Basin, Northern Territory, accessed January 1, 2019, https://geoscience.nt.gov.au/gemis/ntgsjspui/handle/1/86448.
Origin Energy Resources, 2016, Beetaloo W-1 well completion report (basic), EP 117, Beetaloo Basin, Northern Territory, accessed January 1, 2019, https://geoscience.nt.gov.au/gemis/ntgsjspui/handle/1/87806.
Ottmann, J., and K. Bohacs, 2014, Conventional reservoirs hold keys to the ‘un’s, accessed January 1, 2019, https://explorer.aapg.org/story/articleid/3784/conventional-reservoirs-hold-keys-to-the-uns.
Passey, Q. R., K. Bohacs, W. L. Esch, R. Klimentidis, and S. Sinha, 2010, From oil-prone source rock to gas-producing shale reservoir - Geologic and petrophysical characterization of unconventional shale gas reservoirs: International Oil and Gas Conference and Exhibition in China, Beijing, China, June 8–10, 2010, 29 p., doi:10.2118/131350-MS.
Pisarevsky, S. A., S. Å. Elming, L. J. Pesonen, and Z. X. Li, 2014, Mesoproterozoic paleogeography: Supercontinent and beyond: Precambrian Research, v. 244, no. 1, p. 207–225, doi:10.1016/j.precamres.2013.05.014.
Plumb, K., and P. Wellman, 1987, McArthur Basin, Northern Territory: Mapping of deep troughs using gravity and magnetic anomalies: BMR Journal of Australian Geology & Geophysics, v. 10, p. 243–251.
Plummer, P. S., and V. A. Gostin, 1981, Shrinkage cracks: Desiccation or synaeresis?: Journal of Sedimentary Research, v. 51, no. 4, p. 1147–1156, doi:10.1306/212F7E4B-2B24-11D7-8648000102C1865D.
Posarnentier, H. W., and G. P. Allen, 1999, Siliciclastic sequence stratigraphy: Concepts and applications, v. 7: Tulsa, Oklahoma, SEPM, 216 p., doi:10.2110/csp.99.07.
Powell, T. G., M. J. Jackson, L. P. Sweet, I. H. Crick, C. J. Boreham, and R. E. Summons, 1987, Petroleum geology and geochemistry, Middle Proterozoic McArthur Basin: Melbourne, Victoria, Australia, Bureau of Mineral Resources, Geology and Geophysics, 290 p.
Rawlings, D. J., 1999, Stratigraphic resolution of a multiphase intracratonic basin system: The McArthur Basin, northern Australia: Australian Journal of Earth Sciences, v. 46, no. 5, p. 703–723, doi:10.1046/j.1440-0952.1999.00739.x.
Revie, D., 2017a, Unconventional petroleum resources of the Roper Group, McArthur Basin: Darwin, Northern Territory, Australia, Northern Territory Geological Survey Record 2017-002, 71 p.
Revie, D., 2017b, Volumetric resource assessment of the lower Kyalla and middle Velkerri formations of the McArthur Basin: Annual Geoscience Exploration Seminar 2017, Alice Springs, Northern Territory, Australia, March 28–29, 2017, 5 p.
Rohais, S., V. Crombez, T. Euzen, and J. P. Zonneveld, 2018, Subsidence dynamics of the Montney Formation (Early Triassic, western Canada sedimentary basin): Insights for its geodynamic setting and wider implications: Bulletin of Canadian Petroleum Geology, v. 66, no. 1, p. 128–160.
Schaller, M., F. Von Blanckenburg, N. Hovius, and P. W. Kubik, 2001, Large-scale erosion rates from in situ-produced cosmogenic nuclides in European river sediments: Earth and Planetary Science Letters, v. 188, no. 3–4, p. 441–458, doi:10.1016/S0012-821X(01)00320-X.
Sheridan, M., D. R. Johns, H. D. Johnson, and S. Menpes, 2018, The stratigraphic architecture, distribution and hydrocarbon potential of the organic-rich Kyalla and Velkerri shales of the Upper Roper Group (McArthur Basin): The APPEA Journal, v. 58, no. 2, p. 858–864, doi:10.1071/AJ17224.
Smith, M. G., and R. M. Bustin, 2000, Late Devonian and Early Mississippian Bakken and Exshaw black shale source rocks, western Canada sedimentary basin: A sequence stratigraphic interpretation: AAPG Bulletin, v. 84, no. 7, p. 940–960, doi:10.1306/A9673B76-1738-11D7-8645000102C1865D.
Smits, R. G., W. J. Collins, M. Hand, R. Dutch, and J. Payne, 2014, A Proterozoic Wilson cycle identified by Hf isotopes in central Australia: Implications for the assembly of Proterozoic Australia and Rodinia: Geology, v. 42, no. 3, p. 231–234, doi:10.1130/G35112.1.
Spinks, S. C., S. Schmid, A. Pagés, and J. Bluett, 2016, Evidence for SEDEX-style mineralization in the 1.7 Ga Tawallah Group, McArthur Basin, Australia: Ore Geology Reviews, v. 76, p. 122–139, doi:10.1016/j.oregeorev.2016.01.007.
Stow, D. A. V., A.-Y. Huc, and P. Bertrand, 2001, Depositional processes of black shales in deep water: Marine and Petroleum Geology, v. 18, no. 4, p. 491–498, doi:10.1016/S0264-8172(01)00012-5.
Stow, D. A. V., and D. J. W. Piper, 1984, Deep-water fine-grained sediments: facies models, in D. A. Stow and D. J. W. Piper, eds., Fine-grained sediments: Deep-water processes and facies: Geological Society, London, Special Publications 1984, v. 15, p. 611–646, doi:10.1144/GSL.SP.1984.015.01.38.
Summerfield, M. A., and N. J. Hulton, 1994, Natural controls of fluvial denudation rates in major world drainage basins: Journal of Geophysical Research, v. 99, no. B7, p. 13871–13883, doi:10.1029/94JB00715.
Suter, E. H., 2006, Facies models revisited: Clastic shelves, in H. W. Posarnentier and R. G. Walker, eds., Facies models revisited: Tulsa, Oklahoma, SEPM Special Publication 84, p. 339–398.
Tucker, D. H., and D. M. Boyd, 1987, Dykes of Australia detected by airborne magnetic surveys, in W. F. Fahrig and H. C. Halls, eds., Mafic dyke swarms: Geological Association of Canada Special Paper 34, p. 163–172.
Tyson, R. V., 2001, Sedimentation rate, dilution, preservation and total organic carbon: Some results of a modelling study: Organic Geochemistry, v. 32, no. 2, p. 333–339, doi:10.1016/S0146-6380(00)00161-3.
Van Buchem, F. S. P., B. Pradier, and M. Stefani, 2005, Stratigraphic patterns in carbonate source-rock distribution: Second-order to fourth-order control and sediment flux, in N. B. Harris, ed., The deposition of organic-carbon-rich sediments: Models, mechanisms and consequences: Tulsa, Oklahoma, SEPM Special Publication 82, p. 191–223, doi:10.1029/2000J6000327.
Walker, R. G., 1992, Turbidites and submarine fans, in R. G. Walker and N. P. James, eds., Facies models - Response to sea level change: Toronto, Ontario, Canada, Geological Association of Canada, p. 239–264.
Walker, R. G., and A. G. Plint, 1992, Wave- and storm-dominated shallow marine systems, in R. G. Walker and N. P. James, eds., Facies models - Response to sea level change: Toronto, Ontario, Canada, Geological Association of Canada, p. 219–238.
Warren, J. K., S. C. George, P. J. Hamilton, and P. Tingate, 1998, Proterozoic source rocks: Sedimentology and organic characteristics of the Velkerri Formation, Northern Territory, Australia: AAPG Bulletin, v. 82, no. 3, p. 442–463.
Williams, B., 2019, Definition of the Beetaloo Sub-basin: Darwin, Northern Territory, Australia, Northern Territory Geological Survey Record 2019–015, accessed August 17, 2023, https://geoscience.nt.gov.au/gemis/ntgsjspui/handle/1/89822.
Wilson, A., L. Thrane, A. Cote, B. Richards, and C. Altmann, 2021, Borehole image features map depositional environment change in a Mesoproterozoic delta: Insights from the Beetaloo Sub-Basin: First European Association of Geoscientists and Engineers Workshop on Borehole Geology in Asia Pacific, Perth, Western Australia, Australia, March 30–April 1, 2021, 1 p.
Yang, B., A. S. Collins, M. L. Blades, N. Capogreco, J. L. Payne, T. J. Munson, G. M. Cox, and S. Glorie, 2019, Middle–late mesoproterozoic tectonic geography of the north Australia craton: U–Pb and Hf isotopes of detrital zircon grains in the Beetaloo Sub-basin, Northern Territory, Australia: Journal of the Geological Society, v. 176, no. 4, p. 771–784, doi:10.1144/jgs2018-159.
Yang, B., A. S. Collins, M. L. Blades, T. J. Munson, J. L. Payne, S. Glorie, and J. Farkaš, 2020a, Tectonic controls on sedimentary provenance and basin geography of the Mesoproterozoic Wilton package, McArthur Basin, northern Australia: Geological Magazine, v. 159, no. 2, p. 179–198, doi:10.1017/S0016756820001223.
Yang, B., A. S. Collins, G. M. Cox, A. J. M. Jarrett, S. Denyszyn, M. L. Blades, J. Farkaš, and S. Glorie, 2020b, Using Mesoproterozoic sedimentary geochemistry to reconstruct basin tectonic geography and link organic carbon productivity to nutrient flux from a northern Australian large igneous province: Basin Research, v. 32, no. 6, p. 1734–1750, doi:10.1111/bre.12450.
Yang, B., T. M. Smith, A. S. Collins, T. J. Munson, B. Schoemaker, D. Nicholls, G. Cox, J. Farkas, and S. Glorie, 2018, Spatial and temporal variation in detrital zircon age provenance of the hydrocarbon-bearing upper Roper Group, Beetaloo Sub-basin, Northern Territory, Australia: Precambrian Research, v. 304, p. 140–155, doi:10.1016/j.precamres.2017.10.025.
Zeller, M., S. B. Reid, G. P. Eberli, R. J. Weger, and J. L. Massaferro, 2015, Sequence architecture and heterogeneities of a field - Scale Vaca Muerta analog (Neuquén Basin, Argentina) - From outcrop to synthetic seismic: Marine and Petroleum Geology, v. 66, p. 829–847, doi:10.1016/j.marpetgeo.2015.07.021.
AUTHORS
Vincent Crombez is a senior research scientist. Prior to joining Encounter Resources, he had been working for CSIRO in Perth, Australia since 2017. Over his career, he worked on different basins located in various countries, including Canada, Argentina, Greece, Morocco, and Australia. He holds a Ph.D. in geosciences from Sorbonne Université (Paris, France) and an M.Sc. degree in petroleum geology from UniLaSalle (Beauvais, France). He is the corresponding author of this paper.
Marcus Kunzmann has been a basin analyst for Fortescue Metals Group since 2021. From 2016 to 2021, he worked as a postdoctoral researcher and a research scientist for CSIRO in Darwin and Perth, Australia. He earned an M.Sc. degree from the Technische Universität Bergakademie (Freiberg, Germany) and a Ph.D. from McGill University (Montreal, Canada).
Mohinudeen Faiz is a petroleum geoscientist with more than 30 years’ experience in operational and research and development projects. Faiz holds a Ph.D. and an M.Sc. degree from the University of Wollongong (Wollongong, Australia) and a B.Sc. (honours) degree from the University of Peradeniya (Peradeniya, Sri Lanka). He is currently a principal research scientist at CSIRO Energy, where he focuses on integrated petroleum systems analyses for both conventional and unconventional systems. Previously, Faiz worked at Origin Energy, where he was organic geochemistry and petroleum systems modeling subject matter expert and worked on both conventional and unconventional (coal seam gas and shale gas) reservoir exploration and development projects in various basins, including Australia and southern Africa. He is a member of AAPG, the Petroleum Exploration Society of Australia, and the International Committee for Coal and Organic Petrology.
Claudio Delle Piane is a principal research scientist and leader of the Geological Processes Program in CSIRO’s Deep Earth Imaging Futures Science Platform, integrating microstructural investigations, geophysical measurements, and geological modeling to reveal linkages between depositional, diagenetic, and deformational processes and rock properties distribution in sedimentary basins. He completed a Ph.D. in geology in 2007 at the Swiss Federal Institute of Technology (Zurich, Switzerland) and a master’s degree in 2003 from the Department of Earth Sciences of the Roma III University (Rome, Italy).
Stuart Munday has worked as a geochemist for Chemostrat in Western Australia for 5 years. Before this, he was senior geologist at New Zealand Oil & Gas, but spent most of his career at BG Group, where he worked on north African assets before being posted to Brisbane, Australia. He had worked previously for Roc Oil in the North Sea and at ECL, where his focus was on the basins of sub-Saharan Africa.
Anne Forbes is a research analyst in Wood Mackenzie’s Australasia upstream research team. Since joining Wood Mackenzie in early 2022, she has worked on oil and gas assets and the domestic market balance across Australia. Before Wood Mackenzie, she spent 8 years at Chemostrat in a technical geological role in the upstream industry. She specialized in stratigraphic analysis and has worked across Australia’s principal producing basins. She has a bachelor’s degree and a master’s degree in geology from the University of Cambridge (Cambridge, United Kingdom) and a Ph.D. in volcanology from the Open University (Milton Keynes, United Kingdom).
ACKNOWLEDGMENTS
Our thanks go to CSIRO’s Deep Earth Imaging – Future Science Platform and CSIRO’s Energy Business Unit for funding this project. Beicip-Franlab is also acknowledged for providing academic licenses for EasyTraceTM. The Northern Territory Geological Survey is acknowledged for providing access to the well data on their online repository (GEMIS). E. Swierczek is acknowledged for providing the seismic interpretation used in Figure 2. S. Schmid is acknowledged for her constructive comments on the initial manuscript. C. Johnson is acknowledged for her detailed editing of the manuscript. The authors acknowledge previous AAPG Editor Robert K. Merrill, Swapan Sahoo, and an anonymous reviewer for their constructive comments on the manuscript.
DATASHARE 171
Appendix Tables 1–3 are available in an electronic version on the AAPG website (www.aapg.org/datashare) as Datashare 171.