The AAPG/Datapages Combined Publications Database
AAPG Bulletin
Figure
AAPG Bulletin; Year: 2023; Issue: November DOI: 10.1306/10152221163
Return to Full Text
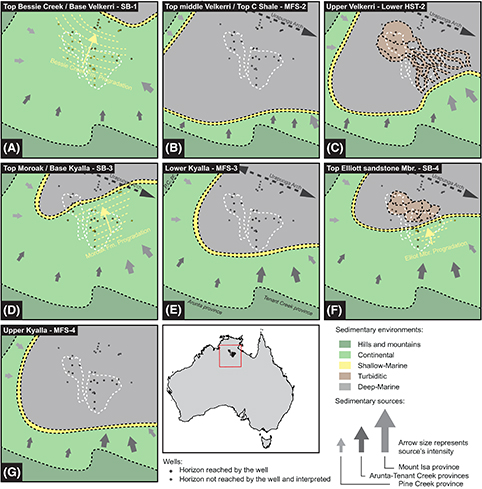
Figure 12.
Schematic paleogeographic evolution during the deposition of the Velkerri and Kyalla Formations and the Moroak Sandstone: (A) sequence boundary (SB)-1, (B) maximum flooding surface (MFS)-2, (C) lower highstand systems tract (HST)-2, (D) SB-3, (E) MFS-3, (F) SB-4, (G) MFS-4. The dotted lines separating the different sedimentary environments reflect the uncertainties of these interpretations. It is important to note that the facies distribution outside the wells’ vicinity is speculative and based on previous works on regional geodynamic interpretations (e.g., Yang et al., 2018). Fm. = Formation; Mbr. = Member.
Figure 12. Schematic paleogeographic evolution during the deposition of the Velkerri and Kyalla Formations and the Moroak Sandstone: (A) sequence boundary (SB)-1, (B) maximum flooding surface (MFS)-2, (C) lower highstand systems tract (HST)-2, (D) SB-3, (E) MFS-3, (F) SB-4, (G) MFS-4. The dotted lines separating the different sedimentary environments reflect the uncertainties of these interpretations. It is important to note that the facies distribution outside the wells’ vicinity is speculative and based on previous works on regional geodynamic interpretations (e.g., Yang et al., 2018). Fm. = Formation; Mbr. = Member.