The AAPG/Datapages Combined Publications Database
AAPG Bulletin
Figure
AAPG Bulletin; Year: 2023; Issue: November DOI: 10.1306/10152221163
Return to Full Text
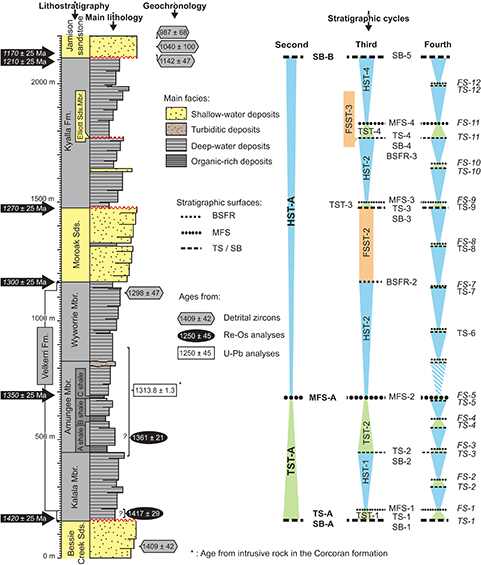
Figure 9.
Lithostratigraphic, chronostratigraphic, and sequence stratigraphic framework of the studied interval (data from Abbott et al., 2001; Kendall et al., 2009; Yang et al., 2018, 2019). Note that this is a composite section based on wells Altree 1, McManus 1, and Elliott 1. The ages in the black arrows are interpreted from all of the available chronostratigraphic data. The ±25 Ma represents 10% of the Velkerri-Kyalla interval deposition. BSFR = basal surface of forced regression; Fm. = Formation; FS = flooding surface; FSST = falling stage systems tract; GR = gamma ray; HST = highstand systems tract; Mbr. = Member; MFS = maximum flooding surface; SB = sequence boundary; Sds. = Sandstone; TS = transgressive surface; TST = transgressive systems tract.
Figure 9. Lithostratigraphic, chronostratigraphic, and sequence stratigraphic framework of the studied interval (data from Abbott et al., 2001; Kendall et al., 2009; Yang et al., 2018, 2019). Note that this is a composite section based on wells Altree 1, McManus 1, and Elliott 1. The ages in the black arrows are interpreted from all of the available chronostratigraphic data. The ±25 Ma represents 10% of the Velkerri-Kyalla interval deposition. BSFR = basal surface of forced regression; Fm. = Formation; FS = flooding surface; FSST = falling stage systems tract; GR = gamma ray; HST = highstand systems tract; Mbr. = Member; MFS = maximum flooding surface; SB = sequence boundary; Sds. = Sandstone; TS = transgressive surface; TST = transgressive systems tract.