The AAPG/Datapages Combined Publications Database
AAPG Bulletin
Figure
AAPG Bulletin; Year: 2024; Issue: January DOI: 10.1306/10242221078
Return to Full Text

Figure 1.
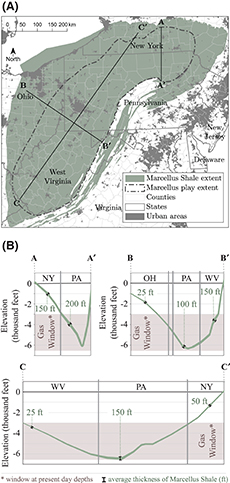
(A) Formation extent and play extent of the Marcellus Shale according to the Energy Information Administration (Popova, 2017). (B) Three cross sections—AA′, BB′, and CC′—are constructed without vertical exaggeration from the Marcellus structure and isopach maps in Popova (2017). The limits of gas windows correlate with the subsea depths of 3000 to 6500 ft. NY = New York; OH = Ohio; PA = Pennsylvania; WV = West Virginia.

Figure 1. (A) Formation extent and play extent of the Marcellus Shale according to the Energy Information Administration (Popova, 2017). (B) Three cross sections—AA′, BB′, and CC′—are constructed without vertical exaggeration from the Marcellus structure and isopach maps in Popova (2017). The limits of gas windows correlate with the subsea depths of 3000 to 6500 ft. NY = New York; OH = Ohio; PA = Pennsylvania; WV = West Virginia.