The AAPG/Datapages Combined Publications Database
AAPG Bulletin
Figure
AAPG Bulletin; Year: 2024; Issue: January DOI: 10.1306/10242221078
Return to Full Text
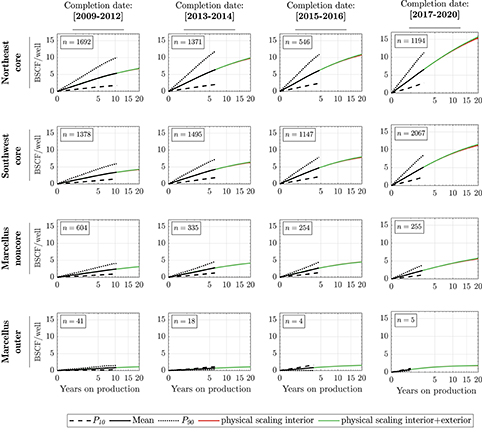
Figure 10.
Extended well prototypes for the 16 well cohorts in the Marcellus Shale. Each row highlights different reservoir qualities and each column signifies different completion dates. Every point of the black line traces the expected values (means) of the generalized extreme value distributions of all of the active horizontal gas wells in each well cohort. The dashed lines labeled  and
and  denote wells whose cumulative production is exceeded by 10% and 90% of wells in each region (upper bound and lower bound, respectively). The physics-based scaling curves that match each average well with and without exterior flow during late time production are denoted by the green (with) and red (without) lines.
Figure 10.
Extended well prototypes for the 16 well cohorts in the Marcellus Shale. Each row highlights different reservoir qualities and each column signifies different completion dates. Every point of the black line traces the expected values (means) of the generalized extreme value distributions of all of the active horizontal gas wells in each well cohort. The dashed lines labeled and denote wells whose cumulative production is exceeded by 10% and 90% of wells in each region (upper bound and lower bound, respectively). The physics-based scaling curves that match each average well with and without exterior flow during late time production are denoted by the green (with) and red (without) lines.