The AAPG/Datapages Combined Publications Database
AAPG Bulletin
Figure
AAPG Bulletin; Year: 2024; Issue: January DOI: 10.1306/10242221078
Return to Full Text
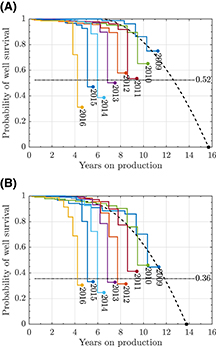
Figure 11.
Probability of survival for (A) the northeast core area and (B) the southwest core area. The colored stairstep lines represent well survival probabilities for different completion years. For instance, in the northeast core area, only 75% of wells completed in 2009 survived after 11 yr. The newer wells survive less longer, so that the average survival probability is only 52%. Finally, from a parabolic extrapolation, we obtain the maximum time of well survival of 14 yr.
Figure 11. Probability of survival for (A) the northeast core area and (B) the southwest core area. The colored stairstep lines represent well survival probabilities for different completion years. For instance, in the northeast core area, only 75% of wells completed in 2009 survived after 11 yr. The newer wells survive less longer, so that the average survival probability is only 52%. Finally, from a parabolic extrapolation, we obtain the maximum time of well survival of 14 yr.