The AAPG/Datapages Combined Publications Database
AAPG Bulletin
Figure
AAPG Bulletin; Year: 2024; Issue: January DOI: 10.1306/10242221078
Return to Full Text
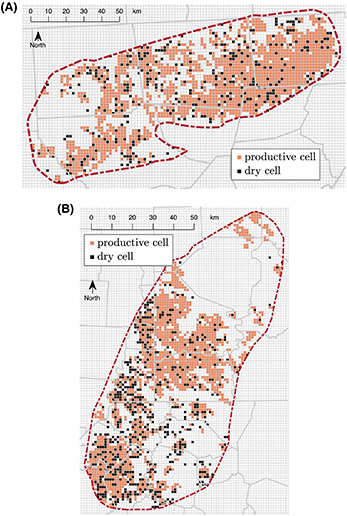
Figure 13.
Map of tested cells in (A) the northeast core and (B) the southwest core of the Marcellus Shale. The probability of success for each region is calculated as a fraction between the number of productive cells (orange) and the total number of tested cells (orange + black).
Figure 13. Map of tested cells in (A) the northeast core and (B) the southwest core of the Marcellus Shale. The probability of success for each region is calculated as a fraction between the number of productive cells (orange) and the total number of tested cells (orange + black).