The AAPG/Datapages Combined Publications Database
AAPG Bulletin
Figure
AAPG Bulletin; Year: 2024; Issue: January DOI: 10.1306/10242221078
Return to Full Text
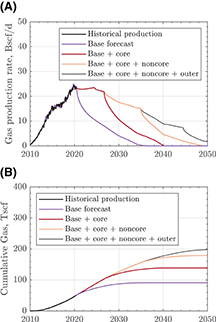
Figure 17.
The predicted total field rate (A) and cumulative gas (B) for the Marcellus Shale based on the infill scenario in Figure 16. Note that the purple lines are the do-nothing production forecasts from the 12,406 existing wells introduced in Figure 12. The red lines correspond to drilling 3684 best potential wells in the core area. The orange lines depict drilling 7896 less-productive wells in the noncore area. Finally, the dark gray lines are the least likely scenario when operators are desperate enough to drill ∼15,000 least-productive wells in the outer area. BSCF = billion standard cubic feet; TSCF = trillion standard cubic feet.
Figure 17. The predicted total field rate (A) and cumulative gas (B) for the Marcellus Shale based on the infill scenario in Figure 16. Note that the purple lines are the do-nothing production forecasts from the 12,406 existing wells introduced in Figure 12. The red lines correspond to drilling 3684 best potential wells in the core area. The orange lines depict drilling 7896 less-productive wells in the noncore area. Finally, the dark gray lines are the least likely scenario when operators are desperate enough to drill ∼15,000 least-productive wells in the outer area. BSCF = billion standard cubic feet; TSCF = trillion standard cubic feet.