The AAPG/Datapages Combined Publications Database
AAPG Bulletin
Figure
AAPG Bulletin; Year: 2024; Issue: January DOI: 10.1306/10242221078
Return to Full Text
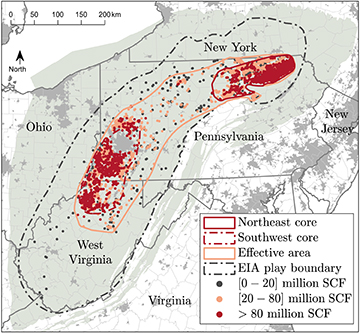
Figure 3.
Scatter map of normalized cumulative production from 12,406 horizontal gas wells in the Marcellus Shale (data adapted from Enverus, 2021) and the outlines of the core areas and the effective area. EIA = Energy Information Administration.
Figure 3. Scatter map of normalized cumulative production from 12,406 horizontal gas wells in the Marcellus Shale (data adapted from Enverus, 2021) and the outlines of the core areas and the effective area. EIA = Energy Information Administration.