The AAPG/Datapages Combined Publications Database
AAPG Bulletin
Figure
AAPG Bulletin; Year: 2024; Issue: January DOI: 10.1306/10242221078
Return to Full Text
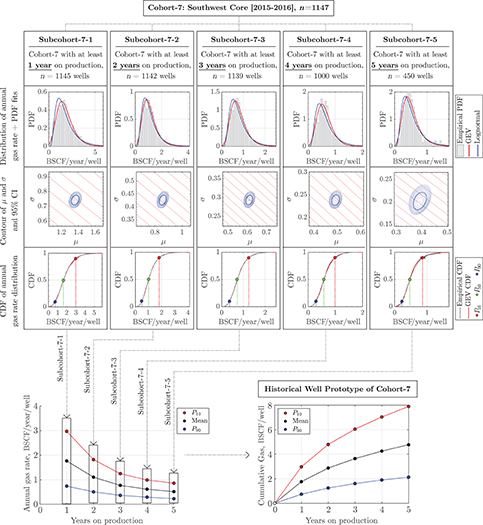
Figure 6.
Illustration of the approach to obtain historical well prototype for each well cohort. As an example, we pick cohort-7, which samples all of the horizontal gas wells in the southwest core area of the Marcellus Shale, completed between 2015 and 2016. We split cohort-7 into the subcohorts 7-j that contain all of the wells with at least j years on production. In this case,  yr. For each subcohort, we fit a generalized extreme value (GEV) distribution and obtain the
  (upper bound), P50 (mean), and
  (lower bound) of the annual gas rate (billion standard cubic feet [BSCF]/yr/well). We then connect the
  , P50, and
  points from the five subcohorts, and use cumulative production as the stable historical well prototype for cohort-7.
  = location parameter of GEV PDF;
  = scale parameter of GEV PDF; CDF = cumulative distribution function; CI = confidence interval; PDF = probability density function.
Figure 6.
Illustration of the approach to obtain historical well prototype for each well cohort. As an example, we pick cohort-7, which samples all of the horizontal gas wells in the southwest core area of the Marcellus Shale, completed between 2015 and 2016. We split cohort-7 into the subcohorts 7-j that contain all of the wells with at least j years on production. In this case, yr. For each subcohort, we fit a generalized extreme value (GEV) distribution and obtain the (upper bound), P50 (mean), and (lower bound) of the annual gas rate (billion standard cubic feet [BSCF]/yr/well). We then connect the , P50, and points from the five subcohorts, and use cumulative production as the stable historical well prototype for cohort-7. = location parameter of GEV PDF; = scale parameter of GEV PDF; CDF = cumulative distribution function; CI = confidence interval; PDF = probability density function.