The AAPG/Datapages Combined Publications Database
AAPG Bulletin
Figure
AAPG Bulletin; Year: 2024; Issue: January DOI: 10.1306/10242221078
Return to Full Text
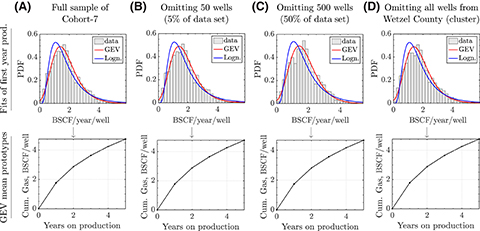
Figure 7.
To demonstrate the predictive power of our approach, we present a sensitivity analysis (cross-validation) for cohort-7. The four sensitivity cases are (A) base case with 100% data, (B) omitting 5% of the data set at random, (C) omitting 50% of the data set at random, and (D) omitting a cluster of wells. For comparison, we plot the distribution of annual gas rate during the first year on production (prod.), fitted with the lognormal (Logn.) and generalized extreme value (GEV) distributions and the corresponding well prototypes for each sensitivity case. We can see that the GEV approach is remarkably stable and consistent in constructing mean well prototypes, even when 50% of all of the wells are omitted. Cum. = cumulative; BSCF = billion standard cubic feet; PDF = probability density function.
Figure 7. To demonstrate the predictive power of our approach, we present a sensitivity analysis (cross-validation) for cohort-7. The four sensitivity cases are (A) base case with 100% data, (B) omitting 5% of the data set at random, (C) omitting 50% of the data set at random, and (D) omitting a cluster of wells. For comparison, we plot the distribution of annual gas rate during the first year on production (prod.), fitted with the lognormal (Logn.) and generalized extreme value (GEV) distributions and the corresponding well prototypes for each sensitivity case. We can see that the GEV approach is remarkably stable and consistent in constructing mean well prototypes, even when 50% of all of the wells are omitted. Cum. = cumulative; BSCF = billion standard cubic feet; PDF = probability density function.