The AAPG/Datapages Combined Publications Database
AAPG Bulletin
Figure
AAPG Bulletin; Year: 2024; Issue: January DOI: 10.1306/10242221078
Return to Full Text
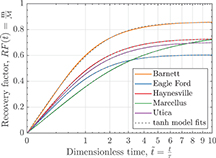
Figure 9.
Physical scaling for top shale gas producers in the United States. The colored solid lines were obtained from numerical simulation results. The dashed lines are the best fits using equation 4.  is the producible hydrocarbon mass per lateral and
  is the cumulative mass of hydrocarbons produced at the time on production t rendered dimensionless by the division through the pressure interference time
  .
.
Figure 9.
Physical scaling for top shale gas producers in the United States. The colored solid lines were obtained from numerical simulation results. The dashed lines are the best fits using equation 4. is the producible hydrocarbon mass per lateral and is the cumulative mass of hydrocarbons produced at the time on production t rendered dimensionless by the division through the pressure interference time .