The AAPG/Datapages Combined Publications Database
AAPG Bulletin
Figure
AAPG Bulletin; Year: 2024; Issue: February DOI: 10.1306/12202222033
Return to Full Text

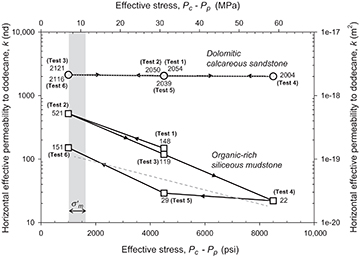
Figure 7.
Plot showing the horizontal permeability to dodecane measured in samples from the organic-rich siliceous mudstone (sample PN3-108; squares) and dolomitic calcareous sandstone (sample PND-17; circles) lithofacies (as examples) at the effective stress conditions specified in our test program (see Figure 4). The arrows indicate the direction of loading and unloading paths. The vertical, gray-shaded rectangle represents the range of in situ mean effective stresses (