The AAPG/Datapages Combined Publications Database
AAPG Bulletin
Figure
AAPG Bulletin; Year: 2024; Issue: February DOI: 10.1306/12202222033
Return to Full Text
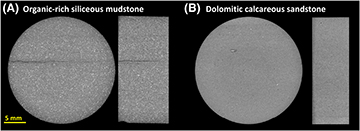
Figure 8.
Microcomputed tomography (CT) cross-sectional views of core plugs acquired after sample preparation and before conducting the permeability tests shown in Figure 7. (A) Organic-rich siliceous mudstone sample (PN3-108) exhibiting one artificial microfracture. (B) The dolomitic calcareous sandstone sample (PND-17) is intact. Images correspond to diametrical (left) and longitudinal (right) cross sections. The samples were CT scanned without confinement. The voxel size is ∼25 μm.
Figure 8. Microcomputed tomography (CT) cross-sectional views of core plugs acquired after sample preparation and before conducting the permeability tests shown in Figure 7. (A) Organic-rich siliceous mudstone sample (PN3-108) exhibiting one artificial microfracture. (B) The dolomitic calcareous sandstone sample (PND-17) is intact. Images correspond to diametrical (left) and longitudinal (right) cross sections. The samples were CT scanned without confinement. The voxel size is ∼25 μm.