The AAPG/Datapages Combined Publications Database
AAPG Bulletin
Figure
AAPG Bulletin; Year: 2025; Issue: March DOI: 10.1306/01282523103
Return to Full Text
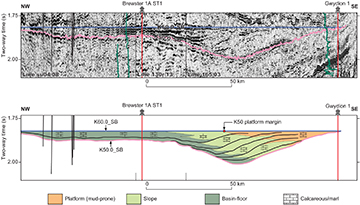
Figure 17. Interpreted seismic profile for the K50 clinoform sequence (see Figure 11E for location). The profile is flattened on the K60.0_SB sequence boundary. Note that vertical exaggeration makes faults appear vertical.
Figure 17. Interpreted seismic profile for the K50 clinoform sequence (see Figure 11E for location). The profile is flattened on the K60.0_SB sequence boundary. Note that vertical exaggeration makes faults appear vertical.