The AAPG/Datapages Combined Publications Database
AAPG Bulletin
Figure
AAPG Bulletin; Year: 2025; Issue: March DOI: 10.1306/01282523103
Return to Full Text
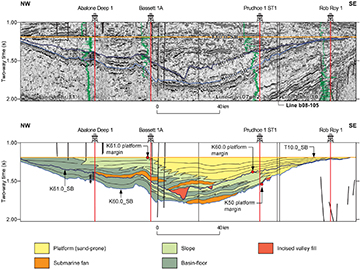
Figure 18. Interpreted seismic profile for the K60.0 and K61.0 clinoform sequences (see Figure 11F, G for location). The profile is flattened on the T10.0_SB sequence boundary. Note that vertical exaggeration makes faults appear vertical.
Figure 18. Interpreted seismic profile for the K60.0 and K61.0 clinoform sequences (see Figure 11F, G for location). The profile is flattened on the T10.0_SB sequence boundary. Note that vertical exaggeration makes faults appear vertical.