The AAPG/Datapages Combined Publications Database
AAPG Bulletin
Figure
AAPG Bulletin; Year: 2025; Issue: April DOI: 10.1306/03182523084
Return to Full Text
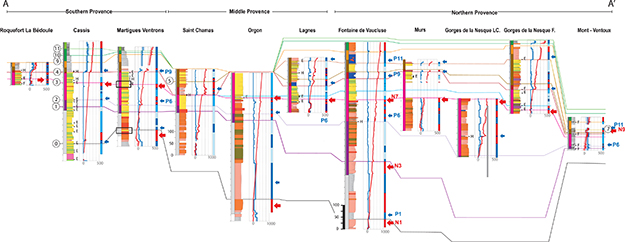
Figure 9. Correlation profile of the bathymetric and AA′ evolution from southern Provence to the western part of the northern Provence. See Figure 1 for location of the cross section. Ammonite zone dating and bathymetry-to-thickness ratio (ΔB/T) are also indicated. Surface numbers (black circles) correspond to marker number. Vertical scale is given along Saint Chamas sedimentary section. The black rectangles indicate the stratigraphic locations of the pictures shown in Figure 9. See Figure 3 for facies legend. Uppercase = major event; lowercase = minor event. E = exposure surface; F = firmground; Gorges de la Nesque F. = Gorges de la Nesque Fayol; Gorges de la Nesque LC. = Gorges de la Nesque Le Cire (see Léonide et al., 2012); H = hardground. N = negative accommodation events (red arrows); P = positive accommodation events (blue arrows).
Figure 9. Correlation profile of the bathymetric and AA′ evolution from southern Provence to the western part of the northern Provence. See Figure 1 for location of the cross section. Ammonite zone dating and bathymetry-to-thickness ratio (ΔB/T) are also indicated. Surface numbers (black circles) correspond to marker number. Vertical scale is given along Saint Chamas sedimentary section. The black rectangles indicate the stratigraphic locations of the pictures shown in Figure 9. See Figure 3 for facies legend. Uppercase = major event; lowercase = minor event. E = exposure surface; F = firmground; Gorges de la Nesque F. = Gorges de la Nesque Fayol; Gorges de la Nesque LC. = Gorges de la Nesque Le Cire (see Léonide et al., 2012); H = hardground. N = negative accommodation events (red arrows); P = positive accommodation events (blue arrows).