The AAPG/Datapages Combined Publications Database
AAPG Bulletin
Figure
AAPG Bulletin; Year: 2025; Issue: April DOI: 10.1306/03182524012
Return to Full Text
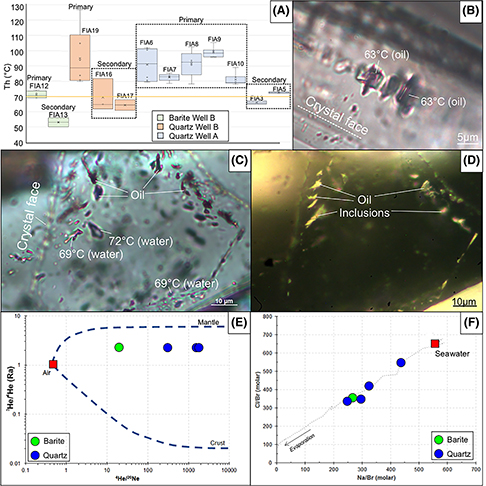
Figure 12. Fluid inclusion microthermometry and geochemical analysis from the Barra Velha Formation. (A) Boxplot showing homogenization temperatures (Th) of fluid inclusion assemblages (FIAs) hosted in barite and quartz cements. Yellow line shows temperature at Top Barra Velha Formation measured in the wells. (B) Primary oil inclusions in quartz in well B. (C) Primary inclusions of oil and water in barite cement filling vuggy porosity in well B. (D) Primary oil inclusions seen under ultraviolet light, showing yellowish fluorescence. (E) Graph of 3He/4He versus 4He/20Ne. Air composition is shown by the red square. Mixing lines between air, crustal, and primordial He composition (mantle) are shown by dashed curves (Torgersen and Jenkins, 1982). (F) Graph of Cl/Br versus Na/Br. Seawater composition is shown by the red square. The dotted line shows seawater evaporation trend.
Figure 12. Fluid inclusion microthermometry and geochemical analysis from the Barra Velha Formation. (A) Boxplot showing homogenization temperatures (Th) of fluid inclusion assemblages (FIAs) hosted in barite and quartz cements. Yellow line shows temperature at Top Barra Velha Formation measured in the wells. (B) Primary oil inclusions in quartz in well B. (C) Primary inclusions of oil and water in barite cement filling vuggy porosity in well B. (D) Primary oil inclusions seen under ultraviolet light, showing yellowish fluorescence. (E) Graph of 3He/4He versus 4He/20Ne. Air composition is shown by the red square. Mixing lines between air, crustal, and primordial He composition (mantle) are shown by dashed curves (Torgersen and Jenkins, 1982). (F) Graph of Cl/Br versus Na/Br. Seawater composition is shown by the red square. The dotted line shows seawater evaporation trend.