The AAPG/Datapages Combined Publications Database
AAPG Bulletin
Figure
AAPG Bulletin; Year: 2025; Issue: August DOI: 10.1306/06302524081
Return to Full Text
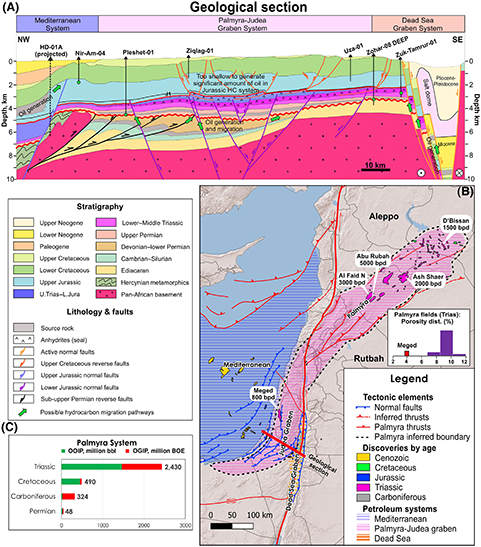
Figure 16. (A) Geological cross section with the petroleum systems through the study area. The Dead Sea graben petroleum system was adapted from Gardosh and Tannenbaum (2014). Note the different structural levels that represent the different tectonic histories in the region. (B) Map that suggests the relationship between the Judea graben and the Palmyra region. Note the shift along the Dead Sea transform. (C) Distribution of the hydrocarbon (HC) discoveries in Palmyra showing the Triassic as a major prospective target. BOE = barrels of oil equivalent; bpd = barrels per day; dist. = distribution; L. Jura = Lower Jurassic; OGIP = original gas in place; OOIP = original oil in place; U. Trias = Upper Triassic.
Figure 16. (A) Geological cross section with the petroleum systems through the study area. The Dead Sea graben petroleum system was adapted from Gardosh and Tannenbaum (2014). Note the different structural levels that represent the different tectonic histories in the region. (B) Map that suggests the relationship between the Judea graben and the Palmyra region. Note the shift along the Dead Sea transform. (C) Distribution of the hydrocarbon (HC) discoveries in Palmyra showing the Triassic as a major prospective target. BOE = barrels of oil equivalent; bpd = barrels per day; dist. = distribution; L. Jura = Lower Jurassic; OGIP = original gas in place; OOIP = original oil in place; U. Trias = Upper Triassic.