The AAPG/Datapages Combined Publications Database
AAPG Bulletin
Full Text
![]() Click to view page images in PDF format.
Click to view page images in PDF format.
AAPG Bulletin, V.
DOI: 10.1306/06302524081
Subsurface mapping of central Israel: Implications for hydrocarbon exploration
Yuval Bartov,1 Stepan Vygovskiy,2 and Yuri Volozh3
1Mosestro Exploration LLP, Modiin, Israel; [email protected]
2Mosestro Exploration LLP, Modiin, Israel; [email protected]
3Mosestro Exploration LLP, Modiin, Israel; [email protected]
ABSTRACT
This study presents the results of the reprocessing of extensive seismic data culminating in enhanced subsurface imaging of the Negev of Israel. A set of structural maps has been produced, significantly improving the understanding of the deeper sedimentary sections of the region. The analysis highlights similarities between the Judea graben (Israel) and the Palmyra trough (Syria), suggesting the presence of a late Paleozoic basin, which is now the Judea graben and the Palmyra trough. We have made a first attempt to fit the petroleum system into the compressional model that seems to describe more accurately the observations from the study area. We believe that the petroleum system should have additional prospectivity in upper or even lower Paleozoic sections. In addition, this study identifies reverse decollement faults in the so-called Judea graben that detached on top of Triassic evaporite and did not interrupt the lower petroleum system. We argue that the main hydrocarbon potential of the Judea graben lies in the Triassic section and below. In contrast, the Cretaceous and Jurassic sections have limited potential because they are too shallow and never reached the oil or gas generation window.
INTRODUCTION
Numerous authors have thoroughly examined the subsurface geology of southern Israel (e.g., Ginzburg and Folkman, 1981; Garfunkel and Derin, 1984; Gvirtzman and Weissbrod, 1984; Druckman et al., 1995b; Gelbermann, 1995; Garfunkel, 1998; Eppelbaum and Katz, 2015; Gao et al., 2019). Despite extensive drilling for oil exploration in the area, onshore significant oil and gas discoveries have been limited (Gardosh and Tannenbaum, 2014). Although detailed studies have been published based on drilled wells (e.g., Derin, 2016), seismic data have been utilized primarily for local prospecting within oil exploration companies.
The history of oil exploration in Israel has been hampered by poor timing because major drilling efforts started before seismic acquisition. The coverage of seismic data in Israel and the distribution of exploration wells may give a misleading impression of a well-explored region. Closer examination reveals, however, that many wells were drilled based on gravity data or surface geology rather than on seismic data (Figure 1).
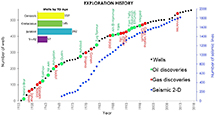 Figure 1.
Deep well drilling versus seismic data acquisition chart. Note that most of the wells were drilled before seismic acquisition. 2-D = two-dimensional; TD = total depth; Tr+PZ = Triassic+Paleozoic.
Figure 1.
Deep well drilling versus seismic data acquisition chart. Note that most of the wells were drilled before seismic acquisition. 2-D = two-dimensional; TD = total depth; Tr+PZ = Triassic+Paleozoic.
Significant efforts are still needed to comprehend the deep subsurface geology of Israel to develop high-quality prospects for oil and gas exploration. This paper outlines the major initiative to enhance deep subsurface imaging and achieve a more accurate regional understanding of deeper geologic sections. We have gathered all available seismic data and reprocessed them using advanced processing technologies. In addition, we collected most of the subsurface data from the existing wells and integrated them with the seismic data (Figure 2). This comprehensive database has shown for the first time the connection between the local and regional geologic setting, providing a valuable tool for investigating questions related to the depositional and tectonic history as well as hydrocarbon exploration of the region.
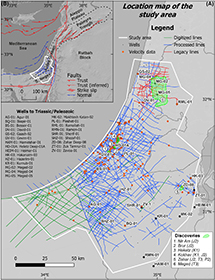 Figure 2.
(A) Location map showing the study area and database of seismic and well data that were used for this study. (B) Overview map of the region, with main tectonic elements.
Figure 2.
(A) Location map showing the study area and database of seismic and well data that were used for this study. (B) Overview map of the region, with main tectonic elements.
Finally, we considered various existing tectonic models, each with different implications for the evolution of the petroleum system and applied our results to evaluate the region’s prospectivity.
GEOLOGIC BACKGROUND
Despite extensive research on the region, there is no consensus on the development of the eastern Mediterranean during the Paleozoic (e.g., Robertson et al., 1996). What follows is a brief geologic history of the study area, considering the two most widely accepted models, which may affect the petroleum system of the region.
Cadomian
Regarding pre-Paleozoic, most authors accept the existence of an active margin along the northern boundary of western Gondwana (Linnemann, 2007; Garfunkel, 2015; Stewart, 2020; Siegesmund et al., 2021; Figure 3A). Evidence of the Cadomian basement has been found in the Avalonia, Iberia, Armorica, Adria, Anatolia, and Cimmeria blocks (von Raumer et al., 2002; Garfunkel, 2015). During this time the northern part of Gondwana, the study area, experienced compressional subsidence (foreland?) leading to accumulation of more than 2-km-thick polymictic conglomerate and poorly sorted coarse- to fine-grained arkose having an unstable heavy mineral assemblage. Associated intrusions and extrusions of mostly alkaline composition add to the great thickness of this succession that covered the consolidated basement. This sedimentary cover is known in the study area as the Zenifim Formation (Weissbrod, 2005; Garfunkel, 2015).
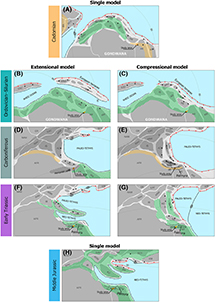
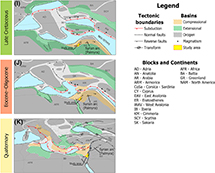 Figure 3.
The compilation of existing tectonic models for pre-Paleozoic to present. The positions of Gondwana, Baltia, Greenland, and North America have been taken from GPlates models (Scotese and Wright, 2018; Cao et al., 2024). The basis of the extensional model was adapted from Stampfli and Borel (2002); the compressional model was adapted from Şengör et al. (1984), van Hinsbergen et al. (2020), and Siegesmund et al. (2021). All of the models were simplified to provide general understanding of the models. (A) Reconstruction of northern Gondwana during the Cadomian. (B, C) Reconstructions of northern Gondwana during the Ordovician–Silurian. (D, E) Reconstructions of Gondwana–Laurussia collision during the Hercynian. (F, G) Reconstructions of the Paleo-Tethys realm during the Early Triassic. (H) Reconstruction of the Neo-Tethys realm during the Middle Jurassic. (I) Reconstruction of the Africa–Eurasia collision during the Late Cretaceous. (J) Reconstruction of the eastern Mediterranean during the Eocene–Oligocene. (K) Location map of the current positions of the continents and blocks with main tectonic elements.
Figure 3.
The compilation of existing tectonic models for pre-Paleozoic to present. The positions of Gondwana, Baltia, Greenland, and North America have been taken from GPlates models (Scotese and Wright, 2018; Cao et al., 2024). The basis of the extensional model was adapted from Stampfli and Borel (2002); the compressional model was adapted from Şengör et al. (1984), van Hinsbergen et al. (2020), and Siegesmund et al. (2021). All of the models were simplified to provide general understanding of the models. (A) Reconstruction of northern Gondwana during the Cadomian. (B, C) Reconstructions of northern Gondwana during the Ordovician–Silurian. (D, E) Reconstructions of Gondwana–Laurussia collision during the Hercynian. (F, G) Reconstructions of the Paleo-Tethys realm during the Early Triassic. (H) Reconstruction of the Neo-Tethys realm during the Middle Jurassic. (I) Reconstruction of the Africa–Eurasia collision during the Late Cretaceous. (J) Reconstruction of the eastern Mediterranean during the Eocene–Oligocene. (K) Location map of the current positions of the continents and blocks with main tectonic elements.
Paleozoic Era
Differences in viewpoints start from the early Paleozoic breakup of the northern part of Gondwana. Two different models, extensional and compressional, are the result.
Extensional Model
After the Avalonian terranes separated from the northern part of western Gondwana in the Early Ordovician, rifting continued eastward through the Silurian, further isolating the European terranes north of the study area (Tiat et al., 1997; Stampfli and Borel, 2002; von Raumer et al., 2002; Figure 3B). This model is further supported by geochemical analysis of Lower Paleozoic magmatic samples from Anatolia, interpreted as products of a rift event (Topuz et al., 2021). In contrast, rocks from the separate Sakarya terrane have been classified as being of subduction-related origin (Topuz et al., 2020).
In the early Paleozoic, the tectonic regime of the northern part of Gondwana transitioned to an extensional passive margin, fostering the development of a stable continental platform (Figure 3B). These conditions persisted until the Hercynian collision between Gondwana and Laurasia (Weissbrod, 2005). Well data from the study area and adjacent regions indicate two uplift events: one in the Late Devonian and another from the early Carboniferous to Permian (Garfunkel and Derin, 1984; Gvirtzman and Weissbrod, 1984; Weissbrod, 2005). The latter was more pronounced, forming the Heletz-Geanticline Swell and resulting in extensive erosion of the entire sub-Permian sedimentary sequence (Figure 3D).
Compressional Model
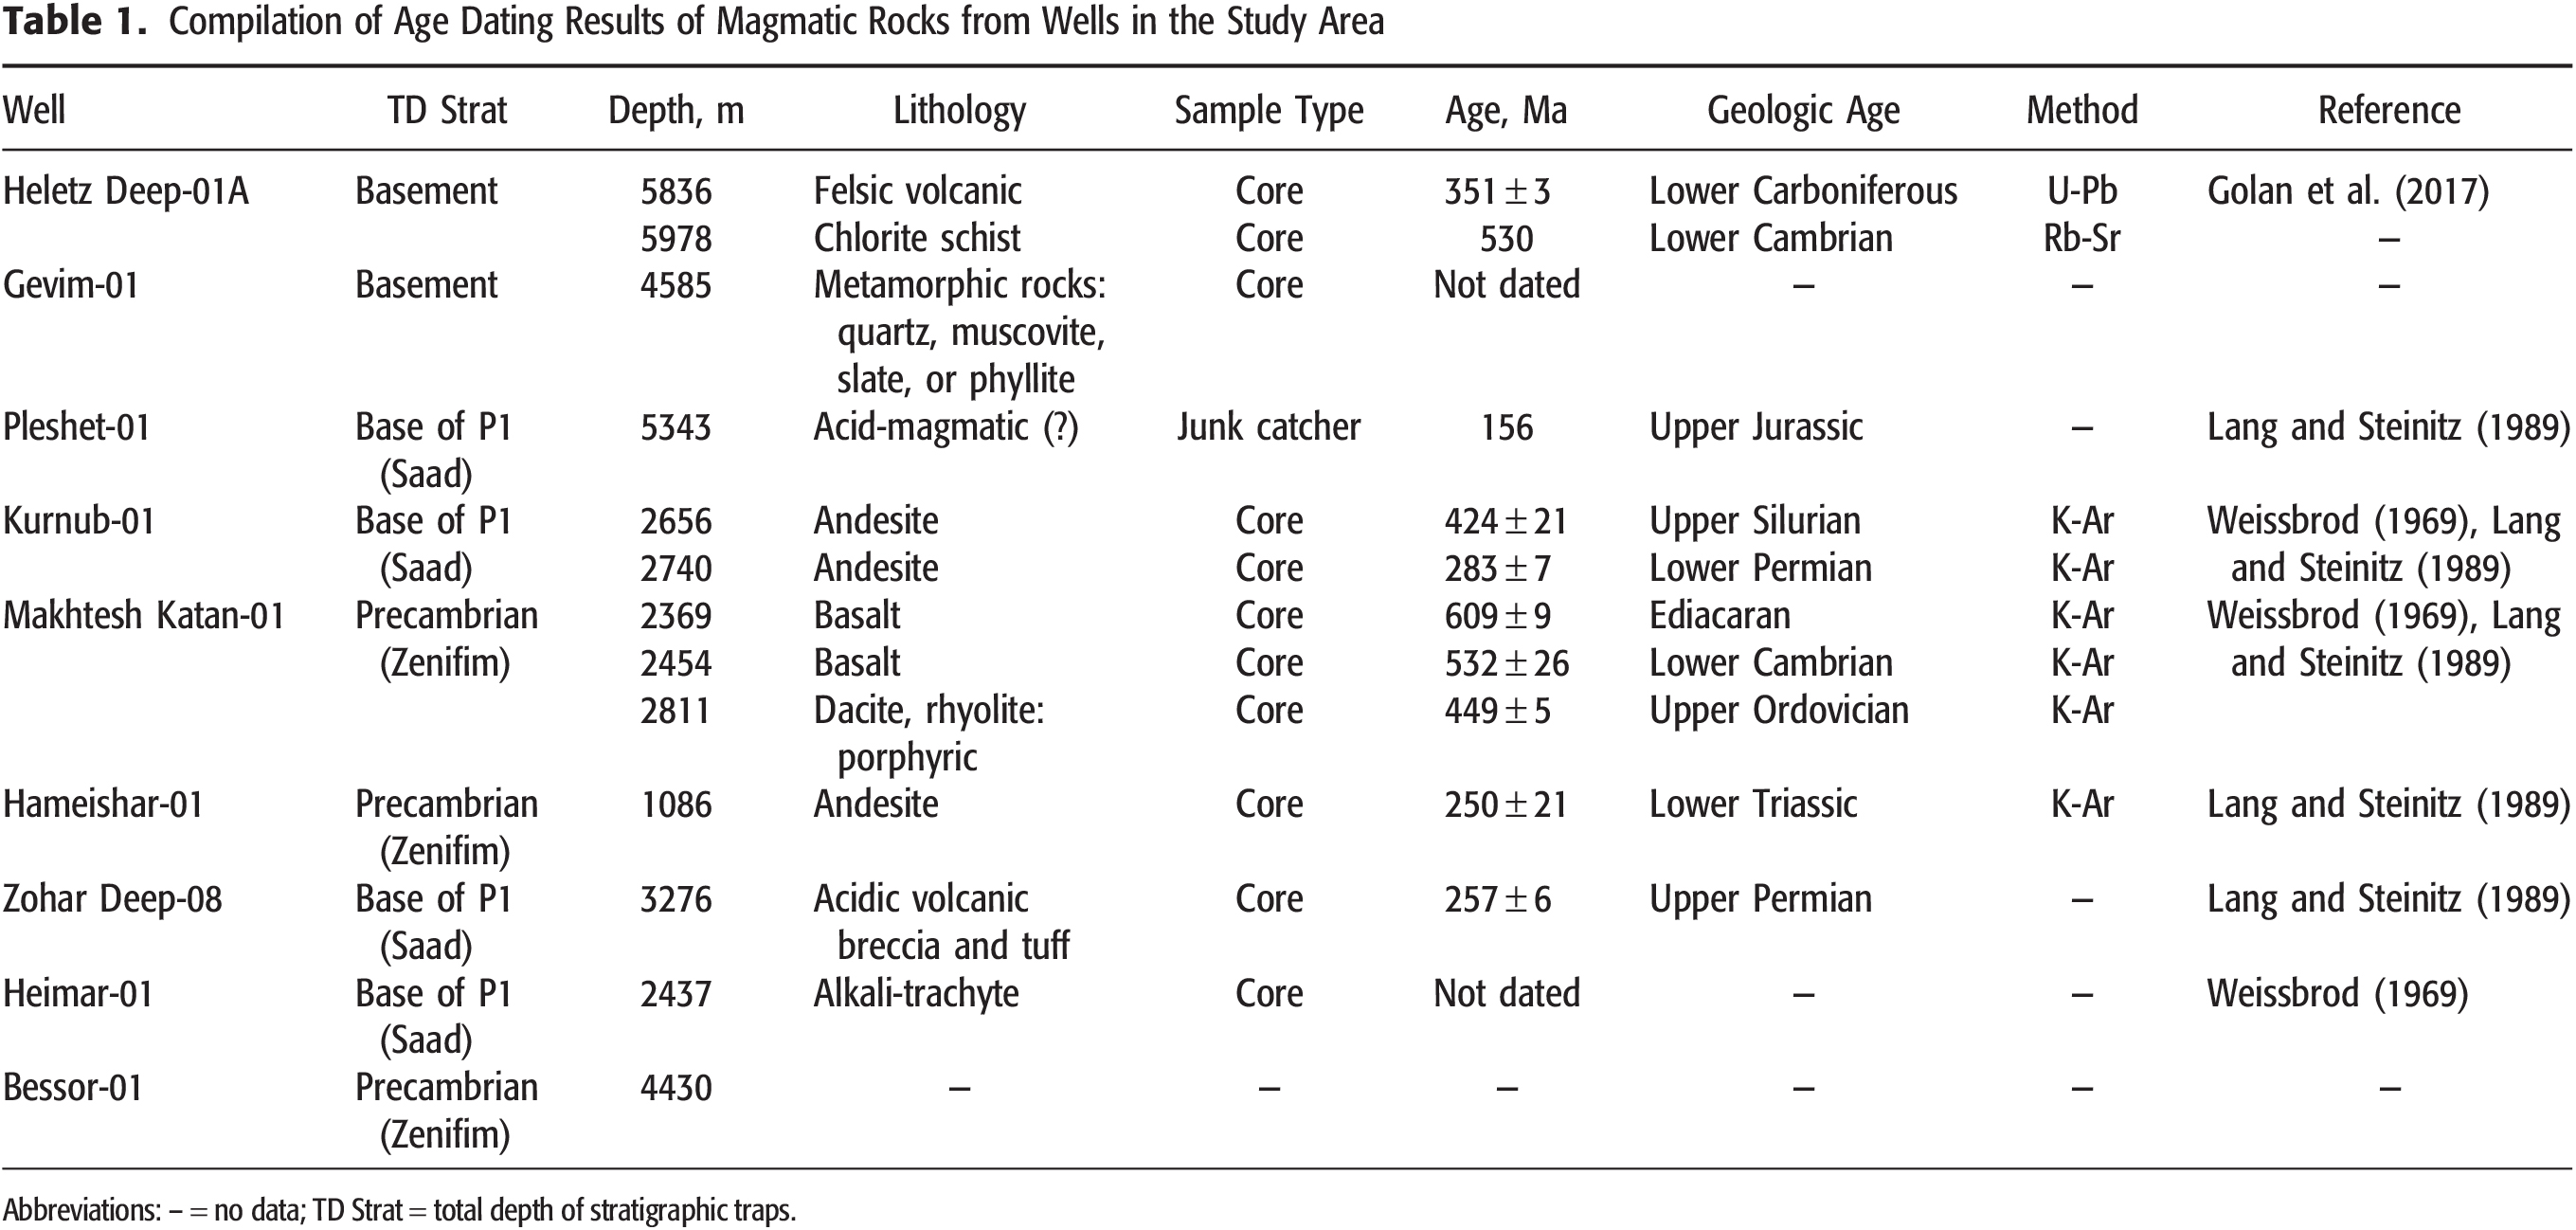
In this model, unlike the Avalonian blocks, the European blocks remained part of Gondwana until they collided with Laurussia, triggering the Hercynian Orogeny (Şengör et al., 1984; van Hinsbergen et al., 2020). Siegesmund et al. (2021) conducted a geochemical analysis of zircon data from the sub-Variscan metasedimentary rocks in European blocks, which suggested a Gondwana origin of the zircon sources (Figure 3C, E). The model proposes that during the early Paleozoic, the region was under a back-arc active margin tectonic regime (Siegesmund et al., 2021), transitioning to foreland settings during the Hercynian Orogeny. Candan et al. (2016) analyzed zircons from metagranites in the Anatolia block and reported that the area was under continental arc conditions during the Carboniferous (Figure 3E). The study area was affected by magmatic activity throughout the entire Paleozoic era (Weissbrod, 1969; Table 1).
In the latest Carboniferous, the Cimmerian block started drifting northward from the eastern edge of Arabia (Muttoni et al., 2009), transforming the region from active continental margin into back-arc basin and eventually into passive margin by the Triassic (Figure 3G). Beginning in the late Permian (Orlov-Labkovsky and Hirsch, 2003), the study area was affected by extensional subsidence, changing the sedimentation pattern from clastic to open-marine carbonates (Figure 3F, G).
According to the compressional model, shallow-marine deposits accumulated in the study area during the early Paleozoic, similar to those found in a passive margin setting (as suggested by the extensional model). In the late Paleozoic, the formation of an orogen to the north of the study area led to the development of a foreland basin, causing compressional subsidence. As a result, the early Paleozoic deposits were not eroded, as in the extensional model but were instead buried and overlain by sediments from the foreland basin.
Mesozoic Era
Both models propose extensional faulting since the late Permian–Early Triassic (Figure 3F, G). The extensional model suggests that faulting began due to the rifting of the passive margin (Garfunkel, 1998), whereas the compressional model attributes normal faulting to the initiation of back-arc extension and subsidence, followed by the opening of the Neo-Tethys (Şengör et al., 1984).
One way or another, from the Middle Jurassic (Figure 3H) onward, both models depict the southern margin of the eastern Mediterranean as having undergone gradual subsidence of a passive margin. This led to the formation of an aggradational carbonate platform at the southern boundary of the Levant that lasted until the Late Cretaceous (Gardosh et al., 2011), whereas shelf sediments accumulated in the center of the basin.
At the Jurassic–Cretaceous boundary, carbonate sedimentation was interrupted by an uplift of the region (Gvirtzman et al., 1998) and sea-level fall (Marcilly et al., 2022), as interpreted from the clastics of the Heletz Formation (Cohen, 1988). Farther to the southeast, a regional unconformity formed, eroding progressively older strata from the Jurassic to the Triassic.
With the closure of the Neo-Tethys ocean during the Late Cretaceous in the eastern Mediterranean, the tectonic regime shifted to compression due to the collision between the African and Laurasian plates (e.g., Sagy and Gvirtzman, 2024). This collision formed prominent structural features known as the Syrian arc, which dominated the upper stratigraphic levels of the Levant (Figure 3I).
In the Late Cretaceous, the sea level began to rise, reaching its peak during the Danian of the early Paleogene (>300 m from the current level) (van der Meer et al., 2022). The carbonate platform submerged, the shoreline transgressed to its maximum distance from the present-day shoreline (Barrier et al., 2018), and the shelf advanced southeast, covering most of Israel. As a result, open-marine carbonates (chalks) and marlstones were deposited in the shallow and deep shelf environment of the Levant Basin (Esestime et al., 2016). These conditions persisted until the Bartonian of the middle Eocene.
Cenozoic Era
As the closure of the Mediterranean Sea progressed, the subsidence rate of the Levant Basin increased significantly due to the collision (proforeland) of the Eratosthenes block and northern Cyprus (Lapierre et al., 2007; Figure 3J). Folds and faults attributed to the Syrian arc continued to develop in the eastern Mediterranean at least until the Pliocene (Sagy et al., 2018). In addition, in the late Eocene, the sea level dropped by 70 m (Miller et al., 2005; van der Meer et al., 2022), leading to the shoreline regression and an increase in the overall area of erosion. The influx of terrigenous material resulted in the formation of a progradational terrigenous shelf over Israel. Since the Miocene, at least three significant sea-level drops were described in the region (Druckman et al., 1995a) that formed the present erosive relief along the border of the eastern Mediterranean and in the study area (Figure 3K).
Presentation and reevaluation of the complex history of the region based on the integrated data set are the central focus of this paper. Here, we present a series of structural maps chosen to illustrate the above history. These maps indicate the close connection of the Palmyra trough to the studied area (Garfunkel, 2004) and show the similarity between the structural features in the Palmyra trough and the northern Negev region. The similar geologic development of these two basins suggests a coeval development of their petroleum systems. In this paper, we analyze the oil and gas prospectivity of southern Israel as a direct analogue to the Palmyra trough.
METHOD
Analysis of Drilled Wells
Oil exploration drilling in Israel started in the late 1940s and has had several phases (Cohen, 1988). Before seismic acquisition began in Israel (1969), more than 250 wells had been drilled using gravity-magnetic data and surface geology, leading to discoveries in Lower Cretaceous sandstones (e.g., Heletz, Kokhav) and Middle–Upper Jurassic carbonates (e.g., Nir-Am, Brur, Zohar).
Tests from the lower Mesozoic and Paleozoic showed weak gas indications (e.g., Agur-01, Pleshet-01, Zohar Deep-08). Interest in these sections grew after the 1994 Meged discovery in Triassic limestones (Mohilla Formation) that is described below.
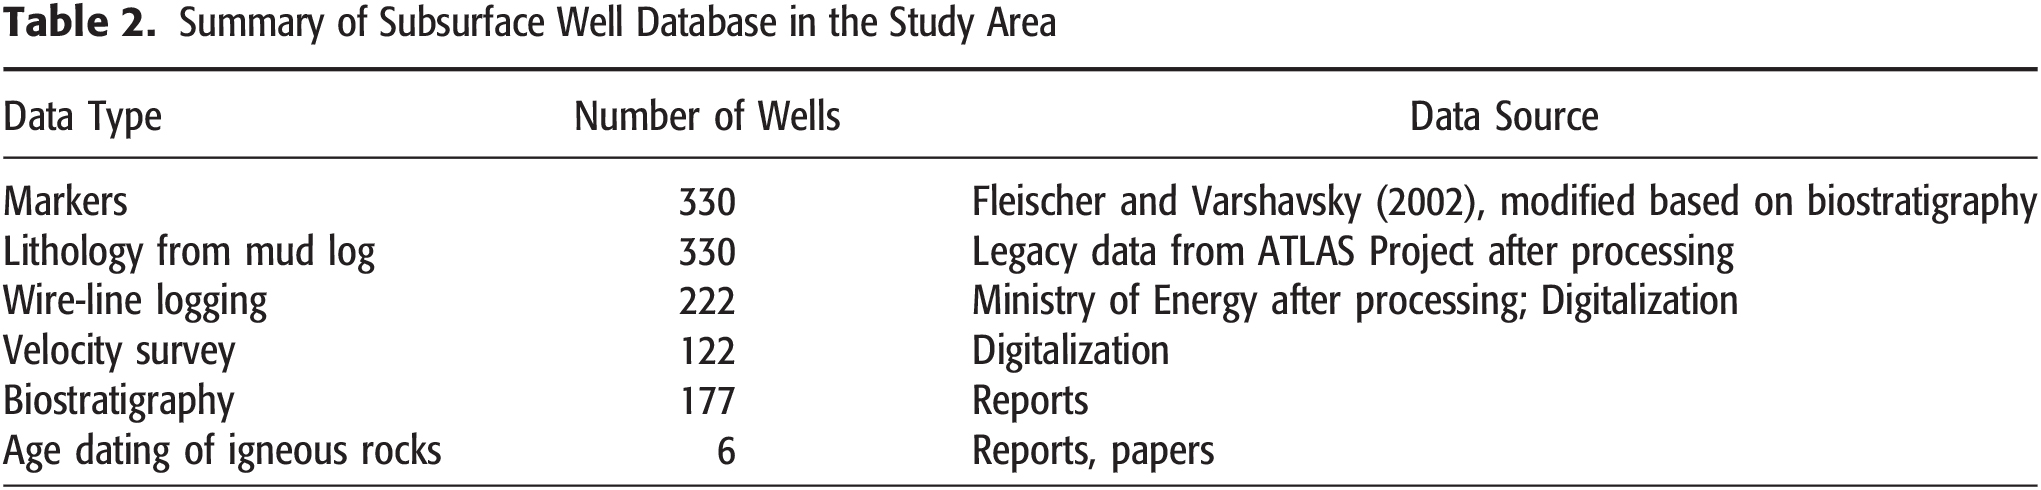
To build a reliable geologic model including Paleozoic section, we analyzed data from 330 wells (Figure 2), and the following data were collected for this study.
• Stratigraphic data (markers) related to the regional geologic maps
• Lithology from mud logs
• Electrical wire-line logging
• Biostratigraphy
• Age dating of igneous rocks
• Velocity data
Since most wells are quite old and were drilled before the Log ASCII Standard (LAS) format existed, they had to be digitized (Table 2) and processed. This extended database provides a reliable foundation for geologic analysis, seismic interpretation, and subsurface mapping down to the top of crystalline basement.
Seismic Data
Seismic surveys in Israel began in the early 1970s (Figure 1). As a result, different parameters and data were used throughout the years. As processing technologies and computer capabilities dramatically improved, efforts were made in the present study to reprocess the data to the same standards using the latest techniques, resulting in improved subsurface imaging. The data include processed data lines with imaging enhancement by applying MultiFocusing technology (Berkovitch et al., 2009). Image lines were digitized from scanned copies of processed data. The final seismic database consists of more than 8000 km in 524 two-dimensional (2-D) lines.
Gravity Data
In an attempt to assess the deeper parts of the basin (below Permian), we used gravity data that were measured in the region. Following the procedure of Bielik et al. (2013), we ran a three-dimensional gravity model using the gravity effect for each mapped layer and calculated separately its contribution to the gravity signal. The objective of this procedure was to compute the gravity effect of the sedimentary section from the surface to the top of the Permian and then subtract it from the Bouguer gravity grid. Interval densities were derived from the velocity model (discussed below) using Gardner’s equation (Gardner et al., 1974). As a result, we obtained the residual gravity field and calculated the depth of the crystalline basement and calibrated it with well data. All surfaces and density grids were modeled using the GMSYS-3D program. This produced a residual gravity grid that represents the structure and lateral density contrast of the Permian section and below.
DATA INTEGRATION AND INTERPRETATION
Stratigraphic Framework
The stratigraphic scheme (Fleischer and Varshavsky, 2002) was correlated across the area using well logs such as gamma ray, spontaneous potential, resistivity, and sonic, plotted with lithology logs, markers, and biostratigraphy (Figure 4). This lithostratigraphic correlation was aggregated into sequences bounded by significant unconformities that reflect the main depositional changes in the history of the region (Figure 4).
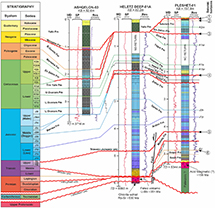 Figure 4.
Stratigraphic correlation between deep wells including the main unconformities (marked by numbers) and horizons that were picked in the seismic lines: (1) base Pliocene unconformity, (2) base upper Eocene unconformity, (3) top Turonian unconformity, (4) Lower Cretaceous (top Jurassic) unconformity, (5) top Triassic unconformity, and (6) top Permian unconformity. B. = Bar; Fm = Formation; J1h = Hettangian; J1p = Pliensbachian; J1s = Senimurian; J1t = Toarcian; J2a = Aalenian; J2b = Bajocian; J2bt = Bathonian; J2c = Callovian; J3km = Kimmeridgian; J3o = Oxfordian; J3t = Tithonian; K1a = Aptian; K1al = Albian; K1b = Berriasian; K1br = Barremian; K1h = Hauterivian; K1v = Valanginian; K2c = Cenomanian; K2cm = Campanian; K2cn = Coniacian; K2m = Maastrichtian; K2s = Santonian; K2t = Turonian; L. = Lower; MD = maximum depth; Res = resistivity; SP = spontaneous potential; T3k = Carnian; T3n = Norian; T3r = Rhaetian; TD = total depth; Trias–Jura = Triassic–Jurassic; U. = Upper; unc. = unconformity.
Figure 4.
Stratigraphic correlation between deep wells including the main unconformities (marked by numbers) and horizons that were picked in the seismic lines: (1) base Pliocene unconformity, (2) base upper Eocene unconformity, (3) top Turonian unconformity, (4) Lower Cretaceous (top Jurassic) unconformity, (5) top Triassic unconformity, and (6) top Permian unconformity. B. = Bar; Fm = Formation; J1h = Hettangian; J1p = Pliensbachian; J1s = Senimurian; J1t = Toarcian; J2a = Aalenian; J2b = Bajocian; J2bt = Bathonian; J2c = Callovian; J3km = Kimmeridgian; J3o = Oxfordian; J3t = Tithonian; K1a = Aptian; K1al = Albian; K1b = Berriasian; K1br = Barremian; K1h = Hauterivian; K1v = Valanginian; K2c = Cenomanian; K2cm = Campanian; K2cn = Coniacian; K2m = Maastrichtian; K2s = Santonian; K2t = Turonian; L. = Lower; MD = maximum depth; Res = resistivity; SP = spontaneous potential; T3k = Carnian; T3n = Norian; T3r = Rhaetian; TD = total depth; Trias–Jura = Triassic–Jurassic; U. = Upper; unc. = unconformity.
Seismic-to-Well Tie
To integrate the stratigraphic horizons with the seismic data, we used checkshot data from 122 wells in conjunction with acoustic logs and generated synthetic seismograms for each well. Moreover, for 50 additional wells, acoustic data were reconstructed from resistivity logs using the Faust equation (Faust, 1953). Subsequently, all 172 wells were correlated with seismic sections (Figure 5).
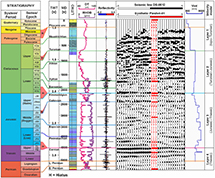 Figure 5.
Synthetic seismogram for Pleshet 01, showing the velocity change through the section. Velocity model intervals are marked. DT = delta time; E. = Early; J1h = Hettangian; J1p = Pliensbachian; J1s = Senimurian; J1t = Toarcian; J2a = Aalenian; J2b = Bajocian; J2bt = Bathonian; J2c = Callovian; J3km = Kimmeridgian; J3o = Oxfordian; J3t = Tithonian; K1a = Aptian; K1al = Albian; K1b = Berriasian; K1br = Barremian; K1h = Hauterivian; K1v = Valanginian; K2c = Cenomanian; K2cm = Campanian; K2cn = Coniacian; K2m = Maastrichtian; K2s = Santonian; K2t = Turonian; L. = Lower; LITHO = lithology; MD = maximum depth; RHOB = bulk density of a formation; T3k = Carnian; T3n = Norian; T3r = Rhaetian; TWT = two-way traveltime; Vint = interval velocity.
Figure 5.
Synthetic seismogram for Pleshet 01, showing the velocity change through the section. Velocity model intervals are marked. DT = delta time; E. = Early; J1h = Hettangian; J1p = Pliensbachian; J1s = Senimurian; J1t = Toarcian; J2a = Aalenian; J2b = Bajocian; J2bt = Bathonian; J2c = Callovian; J3km = Kimmeridgian; J3o = Oxfordian; J3t = Tithonian; K1a = Aptian; K1al = Albian; K1b = Berriasian; K1br = Barremian; K1h = Hauterivian; K1v = Valanginian; K2c = Cenomanian; K2cm = Campanian; K2cn = Coniacian; K2m = Maastrichtian; K2s = Santonian; K2t = Turonian; L. = Lower; LITHO = lithology; MD = maximum depth; RHOB = bulk density of a formation; T3k = Carnian; T3n = Norian; T3r = Rhaetian; TWT = two-way traveltime; Vint = interval velocity.
Velocity Model Concept
The velocity model concept involved identifying the primary velocity changes within the section and specifying the velocity as a function of depth, thickness, and facies. Based on the seismic-to-well tie results, the four most prominent velocity boundaries were selected: top Turonian, top Jurassic, top Triassic, and top Permian. These horizons along with topography were included in the velocity model. At the western part of the study area, two additional surfaces were included: base of Pliocene unconformity and base of upper Eocene unconformity (Figure 4, Ashqelon-03 well).
The velocities observed for these two horizons, as well as for the top Turonian, exhibit a distinct compaction trend (Figure 6). This trend is attributed predominantly to the clastic lithologies present in the section. Consequently, velocities for each interval were calculated separately, accounting for the compaction trend (Figure 6A). Unlike the Pliocene and upper Eocene clastic deposits, the Upper Cretaceous layers are composed of carbonate rocks, made mainly of chalky material, which therefore significantly impacts the velocity (Figure 6D).
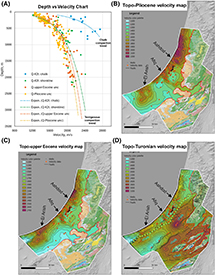 Figure 6.
(A) Velocity-depth chart showing the compaction trends for the first three layers of the velocity model. (B–D) Velocity maps for the top Pliocene (B), top Late Eocene (C), and top Turonian (D), respectively. Expon. = exponent; K2t. = Turonian; Q = Quaternary; unc = unconformity.
Figure 6.
(A) Velocity-depth chart showing the compaction trends for the first three layers of the velocity model. (B–D) Velocity maps for the top Pliocene (B), top Late Eocene (C), and top Turonian (D), respectively. Expon. = exponent; K2t. = Turonian; Q = Quaternary; unc = unconformity.
The velocity of the Cretaceous, Jurassic, and Triassic are associated mainly with depth, trend, and facies changes (Figure 7). Since the sequences are prominently carbonate, the compaction trend is associated with the marly section mostly in the southern part of the study area. This spatial trend is attributed to the influx of clastic material from the southeastern direction.
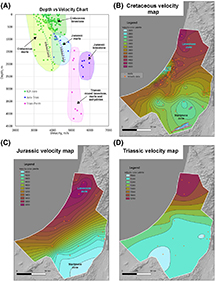 Figure 7.
(A) Velocity-depth chart showing the distribution of the velocities for the “layer cake” velocity model. (B–D) Velocity maps for Cretaceous (B), Jurassic (Jura) (C), and Triassic (Trias) (D) layers, respectively. k2t = Turonian; Perm. = Permian; tend = tendency.
Figure 7.
(A) Velocity-depth chart showing the distribution of the velocities for the “layer cake” velocity model. (B–D) Velocity maps for Cretaceous (B), Jurassic (Jura) (C), and Triassic (Trias) (D) layers, respectively. k2t = Turonian; Perm. = Permian; tend = tendency.
Our final velocity model was calculated from a flat datum 1000 m above mean sea level with replacement velocity 2000 m/s to topography. The top three horizons (Pliocene, Eocene, and Turonian) were calculated from topography using average velocities, whereas the rest of the horizons (Jurassic, Triassic, and Permian) were treated as a “layer cake” model (Figure 8A).
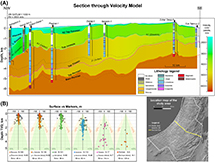 Figure 8.
(A) Cross section through the velocity model (VM) with the correlated surfaces. Note the horizontal variability in the velocity. (B) Mismatch in meters between velocity model (surfaces) and actual marker depth, before the adjustment at well locations. L. = Lower; RV = replacement velocity; TVD = true vertical depth.
Figure 8.
(A) Cross section through the velocity model (VM) with the correlated surfaces. Note the horizontal variability in the velocity. (B) Mismatch in meters between velocity model (surfaces) and actual marker depth, before the adjustment at well locations. L. = Lower; RV = replacement velocity; TVD = true vertical depth.
Depth Conversion and Uncertainty Analysis
After constructing the velocity model, the time horizons were converted into the depth domain. For quality control of the velocity model, we compared the calculated depths of the horizons with the measured depth from the wells and created the “difference crossplots,” showing the offset values and the double standard deviation for normal distribution encompassing 95% of all data errors (Figure 8B). The comparison indicated that the accuracy of the velocity model ranged from 35 to 120 m, depending on the horizon. Based on these parameters, the isoline intervals were chosen for constructing structural maps. Following the analysis, the mapped horizons were fixed to the well data at the well locations and interpolated in between. The results are the depth maps as described below.
RESULTS
The set of depth maps below (Figures 9–15) represent the chosen significant horizons (sequence boundaries) that were selected in the study area. In each map, we describe the main observed structures and tie them to the regional geologic history presented above.
Top Basement Map
The basement structure beneath the study area has been investigated by numerous studies using different methods such as gravity, magnetic, and wide-range seismic refraction data (Ginzburg and Folkman, 1981; Rybakov and Segev, 2004; Weber et al., 2004; Bielik et al., 2013).
Here, we present the top basement map (Figure 9) that we produced using interpretation of 2-D seismic data up to the Permian (Figure 10) and the gravity stripping method described above. During calibration, we applied a higher basement density in the northwestern part (Heletz-Gevim uplift) than in the southeastern part. We used wells penetrating the Saad or Zenifim Formations (Figure 9; Table 1) to limit the minimum depth to the basement or to account for the actual depth in the cases in which the basement was penetrated.
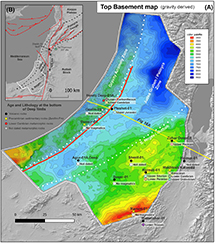 Figure 9.
(A) Regional tectonic map of the area. (B) Depth to basement. The depth was calculated using residual gravity signals calibrated to wells in the area. Note the division to sublocations that correspond with the Palmyra trough in Syria. Fm = Formation.
Figure 9.
(A) Regional tectonic map of the area. (B) Depth to basement. The depth was calculated using residual gravity signals calibrated to wells in the area. Note the division to sublocations that correspond with the Palmyra trough in Syria. Fm = Formation.
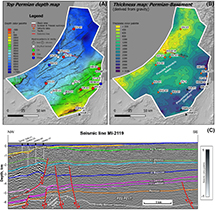 Figure 10.
(A) Top Permian (Arqov Formation) structural map. (B) Isopach map of the sequence between the Permian and basement. (C) Seismic section showing the thickness change of the Triassic–Permian sequence. J = Jurassic; K = Cretaceous; PZ = Paleozoic; T = Triassic; u. Eocene = upper Eocene.
Figure 10.
(A) Top Permian (Arqov Formation) structural map. (B) Isopach map of the sequence between the Permian and basement. (C) Seismic section showing the thickness change of the Triassic–Permian sequence. J = Jurassic; K = Cretaceous; PZ = Paleozoic; T = Triassic; u. Eocene = upper Eocene.
In the southern Negev there is an elevated zone that corresponds to the continuation of the Rutbah block (Figure 2B). The basement surface in this area is overlain by a thick Precambrian section (>2 km in the Ramon-01 well, Figure 10B), the Zenifim Formation (Weissbrod, 1969). In the northwestern part of the area, the Heletz-Gevim uplift is bounded by a reverse fault. In this zone, the basement surface almost reaches the top of the Hercynian unconformity (upper Permian). In the central part of the area, there is a depression that may be associated with the Palmyra trough (Garfunkel, 1998) that may hold remnants of the Paleozoic section.
Comparison of the top of the basement map with results from various authors (Ginzburg and Folkman, 1981; Rybakov and Segev, 2004) reveals a similar structural zonation. However, more features are visible in our map due to the integration of gravity data with high-density seismic 2-D data.
Top Permian
The top Permian structural map (Figure 10A) indicates a depocenter dipping to the north-northeast that is also reflected by the continuation of the Judea graben. The top Permian map corresponds to the upper Permian shallow-marine carbonate Arqov Formation (Orlov-Labkovsky and Hirsch, 2003) that overlies the lower Permian predominantly clastic Saad Formation. Together, these two formations, consisting of sandstones at the bottom to carbonate mudstones at the top, are interpreted as a near-shore deltaic transgressive trend covering the Hercynian unconformity. For a detailed description, the reader is referred to Eshet et al. (1988), Ziegler (2001), Weissbrod (2005), and Stephenson and Korngreen (2020).
The resulting thickness map (Figure 10B) between the top Permian and top basement reveals two elongated depocenters. The first is in the southern part of the mapped area and is filled by Precambrian arkosic sandstone sediments that have been penetrated by several wells. This is in accordance with the overall view of the deep Zenifim basin, which was a foreland basin at that time (Figure 3A). The second basin is located in the central part of the study area (within the Judea graben) and possibly is a continuation of the Paleozoic Palmyra trough (Garfunkel, 1998; Faqira et al., 2009) that may contain upper Paleozoic (Carboniferous?) or even older deposits that have not been penetrated in the Judea graben (Wood, 2015). The Permian section in the Judea graben correlates with the section in the southeastern Palmyra trough in Syria represented by the Amanus Sandstone (Garfunkel, 1998; Brew et al., 2001).
The uplifted area in the southern Negev is a continuation of the Rutbah uplift of southern Syria (Figure 2A). It should also be noted that the seismic section and thickness map between Permian and basement (Figure 10B, C) indicate no significant Permian faulting; the marked normal faults were active in the Triassic and Early Jurassic (e.g., Garfunkel, 1998).
Top Triassic
The structural map of the top Triassic surface (Figure 11A) exhibits a markedly different tectonic configuration compared to the overlying horizons (see below). The southeastern part of the studied area experienced uplifts mostly in the Early Cretaceous (Gvirtzman et al., 1998) and Late Cretaceous–Cenozoic (Arkin et al., 1984; Avni, 1991).
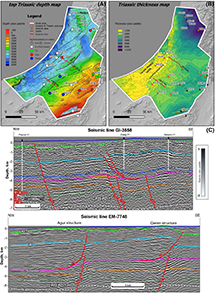 Figure 11.
(A) Top Triassic (Mohilla Formation) structural map. (B) Isopach map of Triassic sequence. (C) Seismic sections showing the Lower Jurassic normal and Upper Cretaceous reverse faults under the Negev monoclines. Note the detachment of reverse faults on top of the Triassic evaporites. J = Jurassic; K = Cretaceous; PZ = Paleozoic; T = Triassic; V = volcanics.
Figure 11.
(A) Top Triassic (Mohilla Formation) structural map. (B) Isopach map of Triassic sequence. (C) Seismic sections showing the Lower Jurassic normal and Upper Cretaceous reverse faults under the Negev monoclines. Note the detachment of reverse faults on top of the Triassic evaporites. J = Jurassic; K = Cretaceous; PZ = Paleozoic; T = Triassic; V = volcanics.
The southern area is characterized by an uplifted structural block, bounded by the northeastern trend, similar to the position shown in the top Permian structural map. To the north of the uplifted area is a subsided depocenter in the so-called Judea graben that extends toward the present-day Mediterranean coastline and formed in the Late Triassic–Early Jurassic (Garfunkel, 1998). Within this developing depocenter, three uplifts are visible: the Sifra, the Meged, and the Heletz-Gevim.
Sifra Uplift
The Sifra uplift is a newly discovered elongated structure located within the Judea graben. The structure is bounded by a northeastern normal fault at the Triassic–Lower Jurassic level and a reverse detachment in the higher stratigraphic levels. This structure does not appear in the Triassic isopach map (Figure 11B), indicating post-Triassic deformation of the compressional fault on a detachment horizon below the top Triassic evaporites.
Meged Uplift
Farther to the north, a similar structure named the Meged is visible. The Meged structure is an inverse early Mesozoic fault structure, formed during the Syrian arc folding events in the Late Cretaceous (Honigstein and Crasquin, 2011). It is considered a southwestern extension of the Syrian Palmyra trough. This structure has been drilled (1998), confirming its hydrocarbon prospectivity. Estimates of recoverable reserves vary between 10 and 100 million bbl of oil. The primary source of oil for the Meged field is considered to be from the Paleozoic sedimentary section of the Judea graben (Gardosh and Tannenbaum, 2014).
Heletz-Gevim Uplift
Another prominent feature situated along the shoreline is the uplifted block called Heletz-Gevim. This block was uplifted in the Early Triassic (Druckman and Kashai, 1981; Druckman, 1984), possibly even earlier, as evidenced by the relatively shallow basement depth found in the Gevim-01 and Heletz Deep-01A wells as well as an old (Paleozoic?) reverse fault that bounds the block from the east (Figure 10C). This indicates a compressional phase before the late Permian.
The new isopach map (Figure 11B) of the Triassic interval shows a thickening trend toward the north and east, whereas the western part is thinner, most likely due to erosion associated with the uplifted areas mentioned above and the depocenter located to the north, where the Judea graben is found. This is in accordance with the stratigraphic distribution of the Triassic sequence (Druckman et al., 1982; Derin, 2016) and the location of the marked evaporitic basins (e.g., Bialik et al., 2012).
Figure 11C shows cross sections along major structures of the northern Negev (Sifra, Agur, and Qeren). These anticlines have normal faults in the Triassic–Lower Jurassic levels and separate detachment faults that seem to slip along the top Triassic evaporites.
In summary, the structural configuration of the top Triassic surface is markedly different from the overlying horizons, reflecting the extensional faulting system as opposed to the following compressional Syrian arc system.
Top Jurassic
The structural and isopach map of the Jurassic interval (Figure 12A) highlights the dramatic changes in Jurassic sediment accumulation across the area, which were strongly influenced by normal faulting during the Early Jurassic (e.g., Garfunkel and Derin, 1984). The map shows a pronounced depocenter located under the Judea Mountains extending toward the southwest. This feature indicates the extension of the main Jurassic depocenter, which was created initially due to extensional faulting during the Early Jurassic (Garfunkel and Derin, 1984; Garfunkel, 1998). This graben-shaped Jurassic depocenter is pronounced toward the Sinai area, accommodating thick clastic sections of the Pliensbachian–Aalenian age (Goldberg and Friedman, 1974; Hirsch and Picard, 1988).
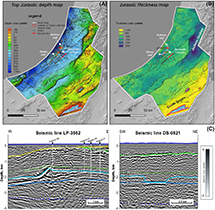 Figure 12.
(A) Top Jurassic structural map. (B) Isopach map of Jurassic sequence. (C) Seismic section through the Jurassic Carbonate reef (LP-3552) and erosional Gevar-Am channel cutting into the Upper Jurassic (DS-0521). J = Jurassic; K = Cretaceous.
Figure 12.
(A) Top Jurassic structural map. (B) Isopach map of Jurassic sequence. (C) Seismic section through the Jurassic Carbonate reef (LP-3552) and erosional Gevar-Am channel cutting into the Upper Jurassic (DS-0521). J = Jurassic; K = Cretaceous.
The Early Cretaceous erosion of the central and southern Negev region further highlights the differences in Jurassic sediment accumulation patterns across the area, as recorded by the isopach map. This unconformity progressively erodes older strata toward the south, including the Jurassic and down to the Triassic. Near the city of Eilat in the south, the Lower Cretaceous lies on top of the Cambrian rocks. Also noteworthy is the observed reverse correlation between the thick Jurassic accumulations and the structural highs. This reflects the structural change from extension in the Early Jurassic to compression from the Late Cretaceous.
A distinct carbonate reef of the Nir-Am Formation (Oxfordian) is present at the edge of the Jurassic carbonate platform (Figure 12C, LP-3552). This reef feature is a prominent characteristic of the top Jurassic and is truncated in places by Early Cretaceous erosion. The Gevar-Am channel incision is a Late Jurassic (Tithonian)–Early Cretaceous erosional event (Hirsch and Picard, 1988). The carbonate reef is dissected by this submarine erosion and subsequently filled with Early Cretaceous siltstone and marl deposits of the Gvaram Formation (Figure 12C, line DS-0521).
Top Turonian
The existing top Turonian map that covers the entire onshore region of Israel (Fleischer and Gafsou, 2003) has been created based on the assemblage of many local structural maps from different authors based on seismic reports and well data. This map covers the whole area of Israel, but because it was not generated using a unified time-depth conversion model, it contains uncertainties in the areas where there is a lack of well information. To overcome this issue, we have constructed a regional integrated velocity model to create a new depth-converted structural map.
A closer examination of the velocities between the topography and the top Turonian (Figure 13A) reveals two distinct compaction trends. The first trend, characterized by lower velocities, is observed in wells located near the shoreline (Figure 6A, D), where thick clastic sediments of the Pliocene and Oligocene developed. The second trend shows relatively higher velocities and is associated with wells situated in Late Cretaceous basins, where chalk formations have developed. Both trends impact the velocity model at different localities on the map.
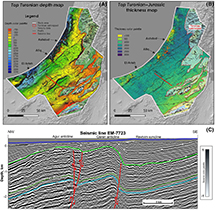 Figure 13.
(A) Top Turonian structural map. (B) Isopach map of Turonian–Jurassic sequence. (C) Seismic section showing the reverse faults under the northern Negev structures. Note the onlaps in the adjacent synclines that indicate the structural activity during deposition (Senonian age). J = Jurassic; K = Cretaceous.
Figure 13.
(A) Top Turonian structural map. (B) Isopach map of Turonian–Jurassic sequence. (C) Seismic section showing the reverse faults under the northern Negev structures. Note the onlaps in the adjacent synclines that indicate the structural activity during deposition (Senonian age). J = Jurassic; K = Cretaceous.
The resulting top Turonian depth map (Figure 13A) highlights structures shaped during the compressional tectonic events of the Late Cretaceous to early Cenozoic. For example, the map clearly illustrates the Qeren and Agur anticlines and the Revivim syncline onlapping on these structures (see also Figure 13C). To the east, the Turonian surface is exposed and truncated, and deeper upper and Early Cretaceous beds are exposed.
The isopach map of the Cretaceous shows three different zones (Figure 13B). Near the shoreline, the carbonate platform is partly truncated by the Pliocene erosion in the central part, where the carbonate platform developed with consistent thickness, and in the southeastern uplifted area where thinner and sandier deposits have accumulated (Arkin et al., 1984; Gvirtzman et al., 1998).
Upper Eocene Unconformity
The lower upper Eocene in the study area is marked by a regional unconformity caused by a 70-m drop in sea level (Buchbinder et al., 1993; Miller et al., 2005; van der Meer et al., 2022). This event led to a shift from carbonate sedimentation in the middle Eocene to marly chalk deposition in the late Eocene (Buchbinder et al., 2005). Offshore, upper Eocene sediments generally lie conformably over middle Eocene deposits, except in areas where submarine erosional canyons formed, such as Ashdod, Afiq, and El-Arish (Druckman et al., 1995a; Bar et al., 2008), and in the southern Negev, where these sediments are absent (Buchbinder et al., 2005). The structure map (Figure 14A, B) illustrates the spatial distribution of submarine canyons across the mapped area. In the seismic line (Figure 14C), white arrows indicate that Oligocene sediments are onlapping onto the upper Eocene unconformity. The southwestern part of the map shows a thicker and deeper basin that preserved the Oligocene section.
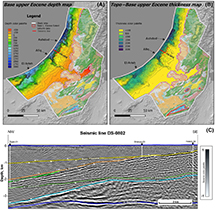 Figure 14.
(A) Upper Eocene unconformity structural map. (B) Isopach map between topography and base upper Eocene unconformity. (C) Seismic section showing the erosive relations between the sequences along the shelf edge. J = Jurassic; K = Cretaceous; L. Eocene = lower Eocene; u. Eocene = upper Eocene.
Figure 14.
(A) Upper Eocene unconformity structural map. (B) Isopach map between topography and base upper Eocene unconformity. (C) Seismic section showing the erosive relations between the sequences along the shelf edge. J = Jurassic; K = Cretaceous; L. Eocene = lower Eocene; u. Eocene = upper Eocene.
Top Miocene (Pliocene Transgression and Erosional Surface)
Following the regression phase of the Late Miocene Mediterranean Messinian crisis (e.g., Druckman et al., 1995a; Ryan, 2009) and the deposition of lowstand evaporites within shelf canyons, a widespread transgression occurred (Figure 15A). This transgression created a ravinement surface at the base of the Pliocene, which is overlain by clay and siltstone deposits of the lower Yafo Formation (Gvirtzman and Buchbinder, 1978; Steinberg et al., 2008). This basal Pliocene erosional surface truncated the shelf edge in places even cutting into Turonian carbonates and extended landward, covering the lower foothill plain of the Judaean Mountains.
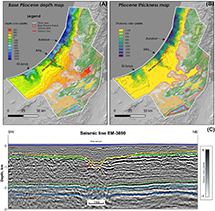 Figure 15.
(A) Base Pliocene structural map. (B) Pliocene isopach map. (C) Seismic section showing the erosive Afiq canyon. J = Jurassic; K = Cretaceous; u. Eocene = upper Eocene.
Figure 15.
(A) Base Pliocene structural map. (B) Pliocene isopach map. (C) Seismic section showing the erosive Afiq canyon. J = Jurassic; K = Cretaceous; u. Eocene = upper Eocene.
Sediment supply during this time was restricted from the continent by the Judaean Mountains and deposited mainly within the shelf area (Bar et al., 2013). As shown by the Pliocene thickness map (Figure 15B), the Pliocene sediments filled most of the erosional channels that had formed within the shelf during the Oligocene and Miocene, such as the Ashdod, Afiq, and El-Arish canyons. The seismic profile though the Afiq canyon (Figure 15C) shows the Pliocene clastics sitting on top of the Messinian unconformity. There is no evidence of deltaic accumulation toward the incised channels on the shelf edge on the isopach map of the Pliocene. This is consistent with the claim that the source of the Pliocene sediments in the region is the Nile (Buchbinder and Zilberman, 1997; Steinberg et al., 2011).
In summary, the Pliocene transgression and associated erosional surface had a significant impact on the sedimentary architecture of the region, reworking and infilling the earlier Oligocene and Miocene erosional features.
DISCUSSION
Reprocessing of a large amount of seismic data with the same parameters and advanced technology led to improved subsurface imaging. The seismic integration with existing subsurface data allowed us to produce the accurate velocity model and understand the deeper (below Triassic) sedimentary section. Since the upper part of the section has been well studied, in this section, we focus on the understudied deeper part starting from the Lower Jurassic and below.
As described above, two models are proposed for the development of the region: an extension model, which envisions the development of a passive margin starting from the early Paleozoic, and a compressional model, according to which a back-arc or foreland basin existed from the early Paleozoic until the early Mesozoic.
Here, we favor the compressional model (Figure 3C, E, G) for several reasons: early and late Paleozoic magmatic activity within the study area (Figure 9; Table 1) and the high gravity anomaly in the northwest of the study area are attributed to changes in basement density. The same anomaly has been identified in the Palmyra trough (Al-Saad et al., 1992; Brew et al., 2001). Dating of quartz porphyry from the Heletz Deep-01 well indicates an early Carboniferous age of circa 351 Ma, suggesting a transitional origin from volcanic arc to within-plate settings (Golan et al., 2018). The analysis of fission-track ages of apatite and sphene in Precambrian basement in Sinai reveal the heating event in the late Paleozoic and Early Triassic (Garfunkel and Derin, 1984). This suggests that the area underwent magmatic reworking during the Paleozoic (see Table 1), which could cause the change in basement density as indicated by the high-gravity zone (Figure 9).
From a hydrocarbon prospectivity standpoint, the extensional model explains the absence of Paleozoic succession in Israel as resulting from late Paleozoic uplift (Gardosh and Tannenbaum, 2014). However, this model struggles to explain oil discoveries in the region. In contrast, the compressional model allows for the preservation of Paleozoic sediments that served as source rocks, filling the Triassic reservoir in the Meged field.
Several authors have examined the association between the Judea graben and the Palmyra trough, providing evidence of their original assembly (Cohen et al., 1990; Garfunkel, 1998; Meiller, 2011) before the Cenozoic left-lateral displacement along the Dead Sea fault (Freund et al., 1970). In this section, we discuss the key findings regarding the similarities between these two structures identified through this work.
The first observation supporting this connection is the lineament separating the Judea graben from the uplifted zone in the southern Negev and southeastern boundary of the Palmyra trough, separating it from the Rutbah block (Figure 9). This lineament shifts laterally along the Dead Sea fault by 105 km (Freund et al., 1970) and is identifiable as the Sheik Ali fault in the Golan Heights (Meiller, 2011).
We argue that a late Paleozoic basin within the mapping area marked by the Judea graben is an extension of the Palmyra trough (Garfunkel and Derin, 1984) (Figure 9A). It is important to note that there is no information about the sub-Permian sedimentary section within the Judea graben because all wells that were drilled in the area terminated in magmatic rock (Figure 4; Table 1) at the base of the Permian section, rather than in the Precambrian Zenifim Formation, as claimed by Weissbrod (1969). We therefore predict a Carboniferous and probably older sedimentary section under the Judea graben similar to the section in the southern Palmyra trough (Brew et al., 2001; Faqira et al., 2009; Wood, 2015).
The second observation supporting this connection is the existence of reverse decollement faults under large anticlinal structures in the Judea graben. Initially, these faults were suggested to be the Late Cretaceous reactivation of the normal extensional late Paleozoic–Early Jurassic system (Freund et al., 1975; Druckman et al., 1995b), but as can be observed in Figure 11C, the reverse faults are clearly separated from the underlying normal faults and do not form the same fault surface. These faults are detachments on the top of the mechanically weak Upper Triassic anhydrite. The reverse faults in the southern Negev/Rutbah area that are penetrated by some wells (e.g., Zohar Deep-08, Sherif-01) show no sign of reactivation (Druckman et al., 1995b), indicating the southern boundary of the Judea graben. This line of evidence points to the similarity between the structural style of the faults in southern Palmyra (Chaimov et al., 1992; Wood, 2015) and that of the northern Negev.
From tectonic, stratigraphic, and petroleum system perspectives, we believe the Palmyra trough and Judean graben originally formed as a single geological entity. In this case, it favors the compressional regime model during the late Paleozoic (Şengör et al., 1984; van Hinsbergen et al., 2020) and allows us to predict that the sedimentary section of the Judea graben petroleum system extends to the Carboniferous or even the lower Paleozoic.
Hydrocarbon Prospectivity of the Judea Graben
The Negev (study area) is divided into three provinces, each characterized by a distinct petroleum system (Figure 16A): the Dead Sea system in the east, the Mediterranean system in the west, and the Judea graben system in the center. The main contribution of this paper is about the Triassic petroleum system within the Judea graben. For a detailed discussion of other systems, see Gardosh and Tannenbaum (2014).
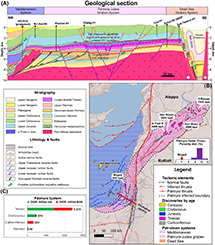 Figure 16.
(A) Geological cross section with the petroleum systems through the study area. The Dead Sea graben petroleum system was adapted from Gardosh and Tannenbaum (2014). Note the different structural levels that represent the different tectonic histories in the region. (B) Map that suggests the relationship between the Judea graben and the Palmyra region. Note the shift along the Dead Sea transform. (C) Distribution of the hydrocarbon (HC) discoveries in Palmyra showing the Triassic as a major prospective target. BOE = barrels of oil equivalent; bpd = barrels per day; dist. = distribution; L. Jura = Lower Jurassic; OGIP = original gas in place; OOIP = original oil in place; U. Trias = Upper Triassic.
Figure 16.
(A) Geological cross section with the petroleum systems through the study area. The Dead Sea graben petroleum system was adapted from Gardosh and Tannenbaum (2014). Note the different structural levels that represent the different tectonic histories in the region. (B) Map that suggests the relationship between the Judea graben and the Palmyra region. Note the shift along the Dead Sea transform. (C) Distribution of the hydrocarbon (HC) discoveries in Palmyra showing the Triassic as a major prospective target. BOE = barrels of oil equivalent; bpd = barrels per day; dist. = distribution; L. Jura = Lower Jurassic; OGIP = original gas in place; OOIP = original oil in place; U. Trias = Upper Triassic.
Given the arguments above, the Judea graben was connected to the Palmyra trough until the formation of the Dead Sea rift in the Oligocene. This allows us to use the prospectivity of the Palmyra as a direct analogue. Nearly 85% of discovered reserves in Palmyra are associated with Triassic or Paleozoic deposits, whereas only 25% are in the Cretaceous (Figure 16C). This distribution reflects key elements of the petroleum system. Source rocks in the Cenozoic and Mesozoic sections are not sufficiently mature to generate significant hydrocarbons (Vulama, 2012). In addition, Triassic evaporites in Palmyra act as both a regional stress accommodator and an effective seal, preventing hydrocarbon leakage.
Building on this geologic context, we analyze the Judea graben petroleum system, considering its evolution under a compressional regime during the early and late Paleozoic (Figure 17).
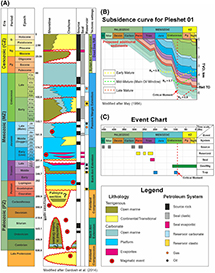 Figure 17.
(A) Generalized stratigraphic scheme for study area, with depositional environments, petroleum system elements, and tectonic settings according to compressional model. (B) Subsidence curve from the Pleshet 01 well. Note that the sedimentary section from Carboniferous and below was not penetrated by any well in the Judea graben. (C) Event cart showing the relationship between the petroleum systems elements from the Pleshet 01 well. Carbon = Carboniferous; Devon = Devonian; Gen/Mig = generation and migration; J1h = Hettangian; J1p = Pliensbachian; J1s = Senimurian; J1t = Toarcian; J2a = Aalenian; J2b = Bajocian; J2bt = Bathonian; J2c = Callovian; J3km = Kimmeridgian; J3o = Oxfordian; J3t = Tithonian; Jura = Jurassic; K1a = Aptian; K1al = Albian; K1b = Berriasian; K1br = Barremian; K1h = Hauterivian; K1v = Valanginian; K2c = Cenomanian; K2cm = Campanian; K2cn = Coniacian; K2m = Maastrichtian; K2s = Santonian; K2t = Turonian; KZ = Cenozoic; Ng = Neogene; O = Oligocene; Perm = Permian; Pg = Paleogene; Q = Quaternary; Ro = vitrinite reflectance; Silur = Silurian; T3k = Carnian; T3n = Norian; T3r = Rhaetian; Trias = Triassic; TD = total depth; TVD = true vertical depth.
Figure 17.
(A) Generalized stratigraphic scheme for study area, with depositional environments, petroleum system elements, and tectonic settings according to compressional model. (B) Subsidence curve from the Pleshet 01 well. Note that the sedimentary section from Carboniferous and below was not penetrated by any well in the Judea graben. (C) Event cart showing the relationship between the petroleum systems elements from the Pleshet 01 well. Carbon = Carboniferous; Devon = Devonian; Gen/Mig = generation and migration; J1h = Hettangian; J1p = Pliensbachian; J1s = Senimurian; J1t = Toarcian; J2a = Aalenian; J2b = Bajocian; J2bt = Bathonian; J2c = Callovian; J3km = Kimmeridgian; J3o = Oxfordian; J3t = Tithonian; Jura = Jurassic; K1a = Aptian; K1al = Albian; K1b = Berriasian; K1br = Barremian; K1h = Hauterivian; K1v = Valanginian; K2c = Cenomanian; K2cm = Campanian; K2cn = Coniacian; K2m = Maastrichtian; K2s = Santonian; K2t = Turonian; KZ = Cenozoic; Ng = Neogene; O = Oligocene; Perm = Permian; Pg = Paleogene; Q = Quaternary; Ro = vitrinite reflectance; Silur = Silurian; T3k = Carnian; T3n = Norian; T3r = Rhaetian; Trias = Triassic; TD = total depth; TVD = true vertical depth.
Source Rock
Drilling data from the Judea graben reveals the presence of organic source rock throughout the section. While Cretaceous and Jurassic intervals show low maturation levels for oil and gas generation (Feinstein, 1996), Triassic and older formations have entered the oil window, with vitrinite reflectance values ranging from 0.7% to 1.2% (Figure 17).
The oldest source rocks penetrated by wells in the Judea graben are Permian shallow-marine organic-rich shales and carbonate beds of the Arqov Formation having total organic carbon (TOC) values of 1.3% to 4% (averaging 2.6) and type III kerogen (Bein et al., 1984; Bar Dayan, 2023). In the Palmyra trough, the oldest analyzed source rocks are Carboniferous open-marine shales and carbonates of the Markada Formation, having TOC values of 0.6% to 1.26% and type II–III kerogen (Vulama, 2012). These sediments potentially exist in the unpenetrated section of the Judea graben.
We note there is also potential for Silurian organic-rich shales and Ordovician source rocks in the deep section of the Judea graben-Palmyra trough system (Figure 17), similar to those found in Jordan (Gardosh and Tannenbaum, 2014). These sections could be preserved according to the compressional tectonic model, explaining the oil prospectivity in Palmyra and the discovery of the Meged oil field in the Judea graben.
Reservoir Rock
Several stratigraphic units in the Judea graben are recognized as hydrocarbon bearing, with the most promising being the Permian Saad Formation and the Triassic Mohilla Formation. The Saad Formation was deposited in a shallow-marine and continental environment (Orlov-Labkovsky and Hirsch, 2003) and consists of sandstone with porosities of 8% to 12%. The Mohilla Formation, deposited in restricted shallow-marine and marginal-marine environments (Bialik et al., 2012), is composed of the fractured highly dolomitized oolitic grainstones. The Mohilla Formation has proven productivity in the Meged field, with matrix porosities ranging from 5% to 17% and permeability on the order of 1 md (Givot Olam Oil, 1995; Calvo, 2014; Gardosh and Tannenbaum, 2014). The Meged-05 well recorded a cumulative production of 1.1 million bbl of oil, with an initial rate of 800 BOPD and oil density of 40 API, primarily from fractures. Similar reservoir properties are observed in fields within the Palmyra trough (Figure 16B), where porosities range from 7% to 12% and initial production rates exceed 1500 BOPD.
Seal
Late Triassic evaporitic sediments above the fractured carbonates act as a regional seal in the Judea graben and Palmyra trough systems. These deposits also accommodate the compressional stresses of the Late Cretaceous, preventing hydrocarbon leakage from deeper horizons into the overlying Mesozoic and Cenozoic units (Figure 16). In the study area, detachment is observed at the top of the Triassic section (Mohilla Formation), but no evidence of pre-Triassic fault reactivation is noted. As a result, the Triassic anhydrites remain undisturbed by faulting events (Figure 11).
In the Meged field, wells have encountered an oil column of ∼700 m, demonstrating the excellent sealing capacity of the Mohilla evaporites. These strong sealing properties may explain the limited success of exploration wells targeting Jurassic reservoirs while highlighting the high prospectivity of the Triassic section in the Judea graben and Palmyra trough systems (Figure 16).
Generation and Migration
The burial history curve that was generated for the Pleshet 01 well, which penetrated the Permian section (Bein et al., 1984), provides no information on potential Paleozoic source rocks or their alteration by Paleozoic magmatic activity (Figure 17). For the Permian and upper sections, the subsidence curve indicates that maturation began in the Late Cretaceous and has continued since then. This implies that the charging is ongoing since the creation of the compressional structures, supporting the potential for hydrocarbon accumulation in the region.
Since the Miocene, the tectonic activity has shifted to the Dead Sea transform fault, implying that younger structural movements along deep-seated structures in the region are relatively minor.
CONCLUSIONS
1. Integration of reprocessed seismic data with wells and gravity has provided improved imaging and understanding of the deeper subsurface geology in southern Israel.
2. The Late Cretaceous compression phase generated detachment faults on top of Triassic evaporites within the Judea graben, but it did not reactivate the Lower Jurassic faults, which is good news for hydrocarbon preservation.
3. The petroleum system in the Judea graben shows promise, with potential source rocks in the Paleozoic section, reservoir rocks in the Permian and Triassic, and seals provided by Upper Triassic evaporites.
4. The study indicates ongoing hydrocarbon generation since the Late Cretaceous, with potential for accumulation in compressional structures formed during this time.
5. The findings favor a compressional regime model during the Paleozoic in the region, which is the cause of the potential of the hydrocarbons in the deep northern Negev.
REFERENCES CITED
Al-Saad, D., T. Sawaf, A. Gebran, M. Barazangi, J. A. Best, and T. A. Chaimov, 1992, Crustal structure of central Syria: The intracontinental Palmyride mountain belt: Tectonophysics, v. 207, no. 3–4, p. 345–358, doi:10.1016/0040-1951(92)90395-M.
Arkin, Y., Y. Bartov, Y. Druckman, Z. Lewy, Y. Mimran, G. Steinitz, T. Weissbrod, and E. Zilberman, 1984, Outlines of the geology of the northwestern Negev: Jerusalem, Israel, Geological Survey of Israel Report GSI/19/84, 118 p., accessed February 1, 2024, https://www.researchgate.net/profile/Ezra-Zilberman-2/publication/288062233_Outlines_of_the_geology_of_the_northern_Negev/links/56b097c108ae8e3721503750/Outlines-of-the-geology-of-the-northern-Negev.pdf.
Avni, Y., 1991, The geology, paleogeography and landscape evolution in the central Negev highlands and western Ramon structure: Jerusalem, Israel, Geological Survey of Israel Report GSI/6/91, 336 p.
Bar, O., Z. Gvirtzman, S. Feinstein, and E. Zilberman, 2013, Accelerated subsidence and sedimentation in the Levant Basin during the Late Tertiary and concurrent uplift of the Arabian platform: Tectonic versus counteracting sedimentary loading effects: Tectonics, v. 32, no. 3, p. 334–350, doi:10.1002/tect.20026.
Bar, O., Z. Gvirtzman, E. Zilberman, and S. Feinstein, 2008, The development of the continental margin of central and southern Israel from early Mesozoic formation to late Tertiary reshaping [in Hebrew]: Jerusalem, Israel, Geological Survey of Israel Report GSI/31/2008, 80 p.
Bar Dayan, N., 2023, Geochemical evaluation of potential source rock for petroleum and their thermal maturity in the Permian-Triassic-Jurassic strata onshore central Israel: Jerusalem, Israel, Geological Survey of Israel Report GSI/02/2023, 95 p.
Barrier, E., B. Vrielynck, J. F. Brouillet, and M. F. Brunet, 2018, Paleotectonic reconstruction of the Central Tethyan Realm. Atlas of 20 maps. Tectono-Sedimentary-Palinspastic maps from Late Permian to Pliocene: Paris, Commission for the Geological Map of the World (CCGM/CGMW), accessed February 1, 2024, https://www.researchgate.net/profile/Marie-Francoise-Brunet/publication/328233233_Paleotectonic_Reconstruction_of_the_Central_Tethyan_Realm_Tectonono-Sedimentary-Palinspastic_maps_from_Late_Permian_to_Pliocene/links/644f66c1809a5350213ef20b/Paleotectonic-Reconstruction-of-the-Central-Tethyan-Realm-Tectonono-Sedimentary-Palinspastic-maps-from-Late-Permian-to-Pliocene.pdf?_tp=eyJjb250ZXh0Ijp7ImZpcnN0UGFnZSI6InB1YmxpY2F0aW9uIiwicGFnZSI6InB1YmxpY2F0aW9uIn19.
Bein, A., S. Feinstein, Z. Aizenshtat, and Y. Weiler, 1984, Potential source rocks in Israel: A geochemical evaluation: Jerusalem, Israel: Geological Survey of Israel Report, 46 p.
Berkovitch, A., I. Belfer, Y. Hassin, and E. Landa, 2009, Diffraction imaging by multifocusing: GEOPHYSICS, v. 74, no. 6, p. WCA75–WCA81, doi:10.1190/1.3198210.
Bialik, O. M., D. Korngreen, and C. Benjamini, 2012, Lithofacies and cyclicity of Mohilla evaporite basins on the rifted margin of the Levant in the Late Triassic, Makhtesh Ramon, southern Israel: Facies, v. 59, p. 2097–2124, doi:10.1111/j.1365-3091.2012.01336.x.
Bielik, M., M. Rybakov, and M. Lazar, 2013, Tutorial: The gravity-stripping process as applied to gravity interpretation in the eastern Mediterranean: The Leading Edge, v. 32, no. 4, p. 365–488, doi:10.1190/tle32040410.1.
Brew, G., M. Barazangi, A. K. Al-Maleh, and T. Sawaf, 2001, Tectonic and geologic evolution of Syria: GeoArabia, v. 6, no. 4, p. 573–616, doi:10.2113/geoarabia0604573a.
Buchbinder, B., R. Calvo, and R. Siman-Tov, 2005, The Oligocene in Israel: A marine realm with intermittent accompanied by mass-flow deposition: Israel: Israel Journal of Earth Sciences, v. 54, no. 2, p. 63–85, doi:10.1560/NGAK-882M-5LM6-8Q93.
Buchbinder, B., G. M. Martinotti, R. Siman-Tov, and E. Zilberman, 1993, Temporal and spatial relationships in Miocene reef carbonates in Israel: Paleogeography, Paleoclimatology, Paleoecology, v. 101, no. 1–2, p. 97–116, doi:10.1016/0031-0182(93)90154-B.
Buchbinder, B., and E. Zilberman, 1997, Sequence stratigraphy of Miocene-Pliocene carbonate-siliciclastic shelf deposits in the eastern Mediterranean margin (Israel): Effects of eustasy and tectonics: Sedimentary Geology, v. 112, no. 1–2, p. 7–32, doi:10.1016/S0037-0738(97)00034-1.
Calvo, R., 2014, A comparative study for potential CO2 storage units in the subsurface Paleozoic-Mesozoic section in southern Israel: Arad Group (Middle Aquifer and Middle Aquitard): Jerusalem, Israel, Geological Survey of Israel Report GSI/25/2014, 76 p.
Candan, O., C. Akal, O. E. Koralay, A. I. Okay, R. Oberhänsli, D. Prelević, and R. Mertz-Kraus, 2016, Carboniferous granites on the northern margin of Gondwana, Anatolide-Tauride Block, Turkey – Evidence for southward subduction of Paleotethys: Tectonophysics, v. 683, p. 349–366, doi:10.1016/j.tecto.2016.06.030.
Cao, X., A. S. Collins, S. Pisarevsky, N. Flament, S. Li, D. Hasterok, and R. D. Muller, 2024, Earth’s tectonic and plate boundary evolution over 1.8 billion years: Geoscience Frontiers, v. 15, no. 6, 101922, 25 p., doi:10.1016/j.gsf.2024.101922.
Chaimov, T. A., M. Barazangi, D. Al-Saad, T. Sawaf, and A. Gebran, 1992, Mesozoic and Cenozoic deformation inferred from seismic stratigraphy in the southwestern intracontinental Palmyride fold-thrust belt, Syria: GSA Bulletin, v. 104, no. 6, p. 704–715, doi:10.1130/0016-7606(1992)104<0704:MACDIF>2.3.CO;2.
Cohen, Z., 1988, Hydrocarbon potential of Israel: Highlights of basin analysis: Tel Aviv, Israel, Oil Exploration (Investments), 148 p.
Cohen, Z., V. Kaptsan, and A. Flexer, 1990, The tectonic mosaic of the southern Levant: Implications for hydrocarbon prospects: Journal of Petroleum Geology, v. 13, no. 4, p. 437–462, doi:10.1111/j.1747-5457.1990.tb00858.x.
Derin, B., 2016, The subsurface of Israel Upper Paleozoic to Upper Cretaceous, Israel, self-published, 338 p.
Druckman, Y., 1984, Evidence for Early-Middle Triassic faulting and possible rifting from the Helez Deep Borehole in the coastal plain of Israel, in J. E. Dixon and A. H. F. Robertson, eds., The geological evolution of the eastern Mediterranean: Geological Society, London, Special Publications 1984, v. 17, p. 203–212, doi:10.1144/GSL.SP.1984.017.01.13.
Druckman, Y., B. Buchbinder, G. M. Martinotti, R. S. Tov, and P. Aharon, 1995a, The buried Afiq Canyon (eastern Mediterranean, Israel): A case study of a Tertiary submarine canyon exposed in Late Messinian times: Marine Geology, v. 123, no. 3–4, p. 167–185, doi:10.1016/0025-3227(94)00127-7.
Druckman, Y., D. Gill, L. Fleischer, E. Gelbermann, and O. Wolff, 1995b, Subsurface geology and structural evolution of the northwestern Negev, southern Israel: Israel Journal of Earth Science, v. 44, p. 115–135.
Druckman, Y., F. Hirsch, and T. Weissbrod, 1982, The Triassic of the southern margin of the Tethys in the Levant and its correlation across the Jordan Rift Valley: Geologische Rundschau, v. 71, no. 3, p. 919–936, doi:10.1007/BF01821111.
Druckman, Y., and E. Kashai, 1981, The Heletz Deep and Devora 2A boreholes and their implication to oil prospects in pre-Jurassic strata in Israel: Jerusalem, Israel, Geological Survey of Israel Report OD/1/81, 32 p.
Eppelbaum, L., and Y. Katz, 2015, Eastern Mediterranean: Combined geological-geophysical zonation and paleogeodynamics of the Mesozoic and Cenozoic structural-sedimentation stages: Marine and Petroleum Geology, v. 65, p. 198–216, doi:10.1016/j.marpetgeo.2015.04.008.
Esestime, P., A. Hewitt, and N. Hodgson, 2016, Zohr – A newborn carbonate play in the Levantine Basin, East-Mediterranean: First Break, v. 34, no. 2, p. 87–93, doi:10.3997/1365-2397.34.2.83912.
Eshet, Y., Y. Druckman, H. L. Cousminer, D. Habib, and W. S. Drugg, 1988, Reworked palynomorphs and their use in the determination of sedimentary cycles: Geology, v. 16, no. 7, p. 662–665, doi:10.1130/0091-7613(1988)016<0662:RPATUI>2.3.CO;2.
Faqira, M., M. Rademakers, and A. M. Afifi, 2009, New insights into the Hercynian Orogeny, and their implications for the Paleozoic hydrocarbon system in Arabian Plate: GeoArabia, v. 14, no. 3, p. 199–228, doi:10.2113/geoarabia1403199.
Faust, L. Y., 1953, A velocity function including lithologic variation: GEOPHYSICS, v. 18, no. 2, p. 271–288, doi:10.1190/1.1437869.
Feinstein, S., 1996, Vitrinite reflectance and maximum heating of the Lower Jurassic Inmar Formation in southern Israel: Israel Journal of Earth Sciences, v. 45, p. 1–10.
Fleischer, L., and R. Gafsou, 2003, Top Judea Group – Digital structural map of Israel: Geophysical Institute of Israel no. 753/306/03, scale 1:200,000, 2 sheets.
Fleischer, L., and A. Varshavsky, 2002, A lithostratigraphic database of oil and gas wells drilled in Israel: Jerusalem, Israel, Geological Survey of Israel Report GSI/9/2002, 280 p., accessed May 1, 2024, https://www.nli.org.il/he/books/NNL_ALEPH990022847700205171/NLI.
Freund, R., Z. Garfunkel, I. Zak, M. Goldberg, T. Weissbrod, B. Derin, F. Bender, E. Wellings, and R. W. Girdler, 1970, The shear along the Dead Sea rift: Philosophical Transactions of the Royal Society A, v. 267, p. 107–130, doi:10.1098/rsta.1970.0027.
Freund, R., M. Goldberg, T. Weissbrod, Y. Druckman, and B. Derin, 1975, The Triassic-Jurassic structure of Israel and its relation to the origin of the eastern Mediterranean: Geological Survey of Israel Bulletin, v. 65, p. 1–26.
Gao, H., X. Tong, Z. Wen, and Z. Wang, 2019, The tectonic evolution of the eastern Mediterranean basin and its control on hydrocarbon distribution: Journal of Petroleum Science and Engineering, v. 178, p. 389–407, doi:10.1016/j.petrol.2019.03.029.
Gardner, G. H. F., L. W. Gardner, and A. R. Gregory, 1974, Formation velocity and density – The diagnostic basics for stratigraphic traps: GEOPHYSICS, v. 39, no. 6, p. 770–780, doi:10.1190/1.1440465.
Gardosh, M., and E. Tannenbaum, 2014, The petroleum systems of Israel, in L. Marlow, C. Kendall, and L. Yose, eds., Petroleum systems of the Tethyan region: AAPG Memoir 106, p. 179–216, doi:10.1306/13431857M106298.
Gardosh, M., P. Weimer, and A. Flexer, 2011, The sequence stratigraphy of Mesozoic successions on the Levant margin, southwestern Israel: A model for the evolution of southern Tethys margins: AAPG Bulletin, v. 95, no. 10, p. 1763–1793, doi:10.1306/02081109135.
Garfunkel, Z., 1998, Constrains on the origin and history of the eastern Mediterranean basin: Tectonophysics, v. 298, no. 1–3, p. 5–35, doi:10.1016/S0040-1951(98)00176-0.
Garfunkel, Z., 2004, Origin of the eastern Mediterranean basin: A reevaluation: Tectonophysics, v. 391, no. 1–4, p. 11–34, doi:10.1016/j.tecto.2004.07.006.
Garfunkel, Z., 2015, The relations between Gondwana and the adjacent peripheral Cadomian domain–Constrains on the origin, history, and paleogeography of the peripheral domain: Gondwana Research, v. 28, no. 4, p. 1257–1281, doi:10.1016/j.gr.2015.05.011.
Garfunkel, Z., and B. Derin, 1984, Permian-early Mesozoic tectonism and continental margin formation in Israel and its implications for the history of the eastern Mediterranean, in J. E. Dixon and A. H. F. Robertson, eds., The geological evolution of the eastern Mediterranean: Geological Society, London, Special Publications 1984, v. 17, p. 187–201, doi:10.1144/GSL.SP.1984.017.01.12.
Gelbermann, E., 1995, Revised seismic structural and isopach maps, central and southern Israel: Ramle, Israel, Israel Institute Petroleum Research Geophysics Report 201/22/88-94, 18 p.
Ginzburg, A., and Y. Folkman, 1981, Geophysical investigation of crystalline basement between Dead Sea rift and Mediterranean Sea: AAPG Bulletin, v. 65, no. 3, p. 490–500, doi:10.1306/2F9197F6-16CE-11D7-8645000102C1865D.
Givot Olam Oil, 1995, Well completion report – Meged #2: Jerusalem, Israel, Givot Olam Oil, 304 p.
Golan, T., Y. Katzir, and M. A. Coble, 2018, Early Carboniferous anorogenic magmatism in the Levant: Implications for rifting in northern Gondwana: International Geology Review, v. 60, no. 1, p. 101–108, doi:10.1080/00206814.2017.1326089.
Goldberg, M., and G. M. Friedman, 1974, Paleoenvironments and paleogeographic evolution of the Jurassic system in southern Israel: Jerusalem, Israel, Geological Survey of Israel Bulletin no. 61, 44 p.
Gvirtzman, G., and B. Buchbinder, 1978, 60. The late Tertiary of the coastal plain and continental shelf of Israel and its bearing on the history of the Eastern Mediterranean, in Deep Sea Drilling Project initial reports 42: Washington, DC, US Government Printing Office, p. 1195–1222.
Gvirtzman, G., and T. Weissbrod, 1984, The Hercynian geanticline of Heletz and the Late Paleozoic history of the Levant, in J. E. Dixon and A. H. F. Robertson, eds., The geological evolution of the eastern Mediterranean: Geological Society, London, Special Publications 1984, v. 17, p. 177–186, doi:10.1144/gsl.sp.1984.017.01.11.
Gvirtzman, Z., Z. Garfunkel, and G. Gvirtzman, 1998, Birth and decay of an intracontinental magmatic swell: Early Cretaceous tectonics of southern Israel: Tectonics, v. 17, no. 3, p. 441–457, doi:10.1029/98TC00235.
Hirsch, F., and L. Picard, 1988, The Jurassic facies in the Levant: Journal of Petroleum Geology, v. 11, no. 3, p. 277–308, doi:10.1111/j.1747-5457.1988.tb00819.x.
Honigstein, A., and S. Crasquin, 2011, Late Scythian-Anisian ostracods (Crustacea) from the Meged-2 borehole, central Israel: Journal of Micropalaeontology, v. 30, no. 1, p. 17–31, doi:10.1144/0262-821X10-022.
Lang, B., and G. Steinitz, 1989, K-Ar dating of Mesozoic magmatic rocks in Israel: A review: Israel Journal of Earth Sciences, v. 38, no. 2–4, p. 89–103.
Lapierre, H., D. Bosch, A. Narros, G. H. Mascle, M. Tardy, and A. Demant, 2007, The Mamonia Complex (SW Cyprus) revisited: Remnant of Late Triassic intra-oceanic volcanism along the Tethyan southwestern passive margin: Geological Magazine, v. 144, no. 1, p. 1–19, doi:10.1017/S0016756806002937.
Linnemann, U., 2007, Ediacaran rocks from the Cadomian basement of the Saxo-Thuringian Zone (NE Bohemian Massif, Germany): Age constraints, geotectonic settings and basin development, in P. Vickers-Rich and P. Komarower, eds., The rise and fall of the Ediacaran biota: Geological Society, London, Special Publications 2007, v. 286, p. 35–51, doi:10.1144/SP286.4.
Marcilly, C. M., Т. H. Torsvik, and C. P. Conrad, 2022, Global Phanerozoic sea levels from paleogeographic flooding maps: Gondwana Research, v. 110, p. 128–142, doi:10.1016/j.gr.2022.05.011.
Meiller, M., 2011, The deep geological structure of the Golan Heights and the evolution of the adjacent Dead Sea fault system, Ph.D. thesis, Tel Aviv University, Tel Aviv, Israel, 167 p.
Miller, K. G., M. A. Kominz, J. V. Browning, J. D. Wright, G. S. Mountain, M. E. Katz, P. J. Sugarman, B. S. Cramer, N. Christie-Blick, and S. F. Pekar, 2005, The Phanerozoic record of global sea-level change: Science, v. 310, no. 5752, p. 1293–1298, doi:10.1126/science.1116412.
Muttoni, G., M. Mattei, M. Balini, A. Zanchi, M. Gaetani, and F. Berra, 2009, The drift history of Iran from the Ordovician to the Triassic, in M.-F. Brunet, M. Wilmsen, and J. W. Granath, eds., South Caspian to central Iran basins: Geological Society, London, Special Publications 2009, v. 312, p. 7–29, doi:10.1144/SP312.2.
Orlov-Labkovsky, O., and F. Hirsch, 2003, Permian deposits in the subsurface of Israel: Lithostratigraphy and foraminifers, in Th. E. Wong, ed., Proceedings of the 15th International Congress on Carboniferous and Permian Stratigraphy, Utrecht, the Netherlands, August 10–16, 2003, p. 547–554.
Robertson, A. H. F., J. E. Dixon, S. Brown, A. Collins, A. Morris, E. Pickett, I. Sharp, and T. Ustaömer, 1996, Alternative tectonic models for the Late Paleozoic-Early Tertiary development of Tethys in the Eastern Mediterranean region, in A. Morris and D. H. Tarling, eds., Palaeomagnetism and tectonics of the Mediterranean region: Geological Society, London, Special Publications 1996, v. 105, p. 239–263, doi:10.1144/GSL.SP.1996.105.01.22.
Ryan, W. B. F., 2009, Decoding the Mediterranean salinity crisis: Sedimentology, v. 56, no. 1, p. 95–136, doi:10.1111/j.1365-3091.2008.01031.x.
Rybakov, M., and A. Segev, 2004, Top of crystalline basement in the Levant: Geochemistry Geophysics Geosystems, v. 5, no. 9, p. 1–8, doi:10.1029/2004GC000690.
Sagy, Y., and Z. Gvirtzman, 2024, Interplay between early rifting, later folding, and sedimentary filling of a long-lived Tethys remnant: The Levant Basin: Earth Science Reviews, v. 252, 104768, 20 p., doi:10.1016/j.earscirev.2024.104768.
Sagy, Y., Z. Gvirtzman, and M. Reshef, 2018, 80 m.y. of folding migration: New perspective on the Syrian arc from Levant Basin analysis: Geology, v. 46, no. 2, p. 175–178, doi:10.1130/G39654.1.
Scotese, C. R., and N. Wright, 2018, PALEOMAP paleodigital elevation models (PaleoDEMS) for the Phanerozoic PALEOMAP Project: EarthByte Research Group, 117 sheets, doi:10.5281/zenodo.5348491.
Şengör, A. M. C., Y. Yılmaz, and O. Sungurlu, 1984, Tectonics of the Mediterranean Cimmerides: nature and evolution of the western termination of Paleo-Tethys, in J. E. Dixon and A. H. F. Robertson, eds., The geological evolution of the eastern Mediterranean: Geological Society, London, Special Publications 1984, v. 17, p. 77–112, doi:https://doi.org/10.1144/GSL.SP.1984.017.01.04.
Siegesmund, S., S. Oriolo, B. Schulz, T. Heinrichs, M. A. S. Basei, and B. Lammerer, 2021, The birth of the Alps: Ediacaran to Paleozoic accretionary processes and crustal growth along the northern Gondwana margin: International Journal of Earth Sciences, v. 110, no. 4, p. 1321–1348, doi:10.1007/s00531-021-02019-7.
Stampfli, G. M., and G. D. Borel, 2002, A plate tectonic model for the Paleozoic and Mesozoic constrained by dynamic plate boundaries and restored synthetic oceanic isochrons: Earth and Planetary Science Letters, v. 196, no. 1–2, p. 17–33, doi:10.1016/S0012-821X(01)00588-X.
Steinberg, J., Z. Gvirtzman, Y. Folkman, and Z. Garfunkel, 2011, Origin and nature of the rapid late Tertiary filling of the Levant Basin: Geology, v. 39, no. 4, p. 355–358, doi:10.1130/G31615.1.
Steinberg, J., Z. Gvirtzman, H. Gvirtzman, and Y. Ben‐Gai, 2008, Late Tertiary faulting along the coastal plain of Israel: Tectonics, v. 27, no. 4, p. 1–22, doi:10.1029/2007TC002151.
Stephenson, R., and D. Korngreen, 2020, Palynological correlation of the Arqov and Saad formations of the Negev, Israel, with the Umm Irna Formation of the eastern Dead Sea, Jordan: Review of Palaeobotany and Palynology, v. 274, no. 3, 104153, 12 p., doi:10.1016/j.revpalbo.2019.104153.
Stewart, S. A., 2020, Structural style of buried Ediacaran basins in Saudi Arabia on seismic reflection data: Precambrian Research, v. 351, no. 12, 105954, 51 p., doi:10.1016/j.precamres.2020.105954.
Tiat, J. A., V. Bachtadse, W. Franke, and H. C. Soffel, 1997, Geodynamic evolution of the European Variscan fold belt: Paleomagnetic and geological constraints: Geologische Rundschau, v. 86, p. 585–598, doi:10.1007/s005310050165.
Topuz, G., O. Candan, A. I. Okay, A. von Quadt, M. Othman, T. Zack, and J. Wang, 2020, Silurian anorogenic basic and acidic magmatism in northwest Turkey: Implications for the opening of the Paleo-Tethys: Lithos, v. 356–357, 105302, 14 p., doi:10.1016/j.lithos.2019.105302.
Topuz, G., O. Candan, J.-M. Wang, Q.-L. Li, F.-Y. Wu, and A. Yilmaz, 2021, Silurian A-type metaquartz-syenite to -granite in the eastern Anatolia: Implications for Late Ordovician-Silurian rifting at the northern margin of Gondwana: Gondwana Research, v. 91, p. 1–17, doi:10.1016/j.gr.2020.12.005.
van der Meer, D. G., C. R. Scotese, B. J. W. Mills, A. Sluijs, A.-P. van den Berg van Saparoea, and R. M. B. van de Weng, 2022, Long-term Phanerozoic global mean sea level: Insights from strontium isotope variations and estimates of continental glaciation: Gondwana Research, v. 111, p. 103–121, doi:10.1016/j.gr.2022.07.014.
van Hinsbergen, D. J. J., T. H. Torsvik, S. M. Schmid, L. C. Maţenco, M. Maffione, R. L. M. Vissers, D. Gürer, and W. Spakman, 2020, Orogenic architecture of the Mediterranean region and kinematic reconstruction of its tectonic evolution since the Triassic: Gondwana Research, v. 81, p. 79–229, doi:10.1016/j.gr.2019.07.009.
von Raumer, J. F., G. M. Stampfli, G. Borel, and F. Bussy, 2002, Organization of pre-Variscan basement area at the north-Gondwanan margin: International Journal of Earth Sciences, v. 91, p. 35–52, doi:10.1007/s005310100200.
Vulama, I., 2012, Source rock potential and petroleum systems of the Triassic and Paleozoic successions of the Hayan Block, central Syrian Palmyrides: AAPG Annual Conference and Exhibition, Long Beach, California, April 22–25, 2012, accessed May 1, 2024, https://www.searchanddiscovery.com/abstracts/html/2012/90142ace/abstracts/extended/vulama.pdf.
Weber, M., K. Abu-Ayyash, A. Abueladas, A. Agnon, H. Al-Amoush, A. Babeyko, Y. Bartov, DESERT Group, , 2004, The crustal structure of the Dead Sea Transform: Geophysical Journal International, v. 156, no. 3, p. 655–681, doi:10.1111/j.1365-246X.2004.02143.x.
Weissbrod, T., 1969, The Paleozoic of Israel and adjacent countries. Part 1: The subsurface Paleozoic stratigraphy of southern Israel: Geological Survey of Israel Bulletin, v. 47, 51 p.
Weissbrod, T., 2005, The Paleozoic in Israel and environs, in J. K. Hall, V. A. Krasheninnikov, F. Hirsch, C. Benjamini, and A. Flexer, eds., Geological framework of the Levant. Volume II: The Levantine Basin and Israel: Jerusalem, Israel, Historical Productions-Hall, p. 283–316.
Wood, B. G. M., 2015, Rethinking post-Hercynian basin development: GeoArabia, v. 20, no. 3, p. 175–224, doi:10.2113/geoarabia2003175.
Ziegler, A. M., 2001, Late Permian to Holocene paleo-facies evolution of the Arabian Plate and its hydrocarbon occurrences: GeoArabia, v. 6, no. 3, p. 445–504, doi:10.2113/geoarabia0603445.
AUTHORS
Yuval Bartov earned his Ph.D. from the Hebrew University of Jerusalem and served as a lecturer at Colorado School of Mines, where he led several projects on the research of carbon energy sources. During his academic career, he taught petroleum and gas geology in the petroleum and gas studies program at the Technion between 2014 and 2017. He served as chief geologist for oil and gas exploration companies in Israel and abroad. In 2020, he joined Mosestro, where he has since served as the company’s exploration manager.
Stepan Vygovskiy is an exploration geologist specializing in sedimentary basin analysis and hydrocarbon prospectivity assessment. His expertise includes seismic interpretation, petrophysics, and sedimentology, with a focus on integrating diverse subsurface datasets to support basin-scale evaluations and exploration portfolio development.
Yuri Volozh has more than 50 years of experience in oil exploration and geology. As senior researcher at the Geological Institute of the Russian Academy of Sciences, he was credited with proven successes in oil and gas discoveries, including the Kashagan oil field in Kazakhstan, one of the largest oil fields in the world. He has served as an expert consultant to the world’s largest oil and gas companies (including Total, BP, Conco, ExxonMobil, and Gazprom) on various projects in Russia, Kazakhstan, and Belarus. He is one of the founders of Mosestro, established in 2020.
Acknowledgments
We want to thank Amir Sagy for an early review and comments for this paper. We also want to acknowledge Norman Rosen for significantly improving the manuscript at all of its stages.