The AAPG/Datapages Combined Publications Database
AAPG Bulletin
Figure
AAPG Bulletin; Year: 2025; Issue: August DOI: 10.1306/06302524081
Return to Full Text
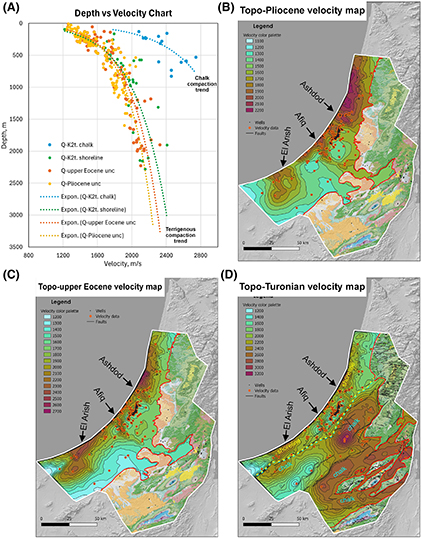
Figure 6. (A) Velocity-depth chart showing the compaction trends for the first three layers of the velocity model. (B–D) Velocity maps for the top Pliocene (B), top Late Eocene (C), and top Turonian (D), respectively. Expon. = exponent; K2t. = Turonian; Q = Quaternary; unc = unconformity.
Figure 6. (A) Velocity-depth chart showing the compaction trends for the first three layers of the velocity model. (B–D) Velocity maps for the top Pliocene (B), top Late Eocene (C), and top Turonian (D), respectively. Expon. = exponent; K2t. = Turonian; Q = Quaternary; unc = unconformity.