The AAPG/Datapages Combined Publications Database
AAPG Bulletin
Figure
AAPG Bulletin; Year: 2025; Issue: August DOI: 10.1306/06302524081
Return to Full Text
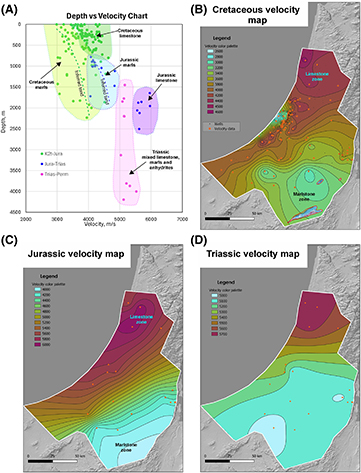
Figure 7. (A) Velocity-depth chart showing the distribution of the velocities for the “layer cake” velocity model. (B–D) Velocity maps for Cretaceous (B), Jurassic (Jura) (C), and Triassic (Trias) (D) layers, respectively. k2t = Turonian; Perm. = Permian; tend = tendency.
Figure 7. (A) Velocity-depth chart showing the distribution of the velocities for the “layer cake” velocity model. (B–D) Velocity maps for Cretaceous (B), Jurassic (Jura) (C), and Triassic (Trias) (D) layers, respectively. k2t = Turonian; Perm. = Permian; tend = tendency.