The AAPG/Datapages Combined Publications Database
AAPG Bulletin
Figure
AAPG Bulletin; Year: 2025; Issue: August DOI: 10.1306/06302524081
Return to Full Text
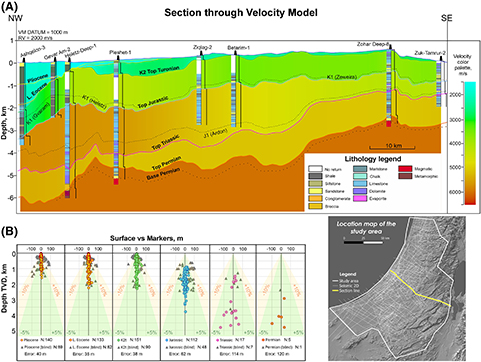
Figure 8. (A) Cross section through the velocity model (VM) with the correlated surfaces. Note the horizontal variability in the velocity. (B) Mismatch in meters between velocity model (surfaces) and actual marker depth, before the adjustment at well locations. L. = Lower; RV = replacement velocity; TVD = true vertical depth.
Figure 8. (A) Cross section through the velocity model (VM) with the correlated surfaces. Note the horizontal variability in the velocity. (B) Mismatch in meters between velocity model (surfaces) and actual marker depth, before the adjustment at well locations. L. = Lower; RV = replacement velocity; TVD = true vertical depth.