The AAPG/Datapages Combined Publications Database
Environmental Geosciences (DEG)
Full Text
![]() Click to view page images in PDF format.
Click to view page images in PDF format.
Environmental Geosciences, V.
DOI: 10.1306/eg.01222019023
Analysis of global navigation satellite system data along the Southern Gas Corridor and estimate of the expected displacements
Giuliana Rossi,1 Riccardo Caputo,2 David Zuliani,3 Paolo Fabris,4 Massimiliano Maggini,5 and Panagiotis Karvelis6
1National Institute of Oceanography and Applied Geophysics (OGS), Sgonico, Italy; [email protected]
2Department of Physics and Earth Sciences, University of Ferrara, Ferrara, Italy; Centro Interuniversitario per la Sismotettonica Tridimensionale Research Unit (CRUST-UR Ferrara), Ferrara, Italy; [email protected]
3OGS, Udine, Italy; [email protected]
4OGS, Udine, Italy; [email protected]
5Department of Physics and Earth Sciences, University of Ferrara, Ferrara Italy; CRUST-UR Ferrara, Ferrara, Italy; [email protected]
6Korros-E, Athens, Greece; [email protected]
ABSTRACT
In the present paper, we analyze the final part of the Southern Gas Corridor, a route highlighted in the European energy security and energy union strategies. This route crosses one of the most seismically active zones of the Mediterranean with several recognized crustal-scale seismogenic sources. We focus on the possibility of identifying the areas where critical differential motions could be expected along the route, which will be occupied by the Trans Adriatic Pipeline, over the nominal pipeline life span of 50 yr. We analyze the available global navigation satellite system data and compare the results to the deformation patterns of the most significant faults affecting the area. We interpolated the sparsely available velocity vectors and calculated strain rate information, both considering the region as a continuum and by applying an original algorithm that allows the linear interpolation within individual blocks. The blocks are characterized by a relatively homogenous deformational behavior, or a specific tectonic setting, independently upon the neighboring ones. The results of the two methods are then compared by calculating the maximum displacement that would cumulate in the next 50 yr of the pipeline lifespan and the differential displacements that could cause possible bending phenomena to the pipeline structure. The methodological approach followed in this research could be applied to other infrastructures to identify the segments prone to localized deformation because of interseismic tectonic loading.
INTRODUCTION
Infrastructures that extend for kilometers and that have to last for some decades, as is the case of pipelines, can be affected in their integrity by differential movements of the ground (e.g., O’Rourke and Liu, 1999, and references therein). Earthquakes can determine sudden and relevant surface displacements so that the pipeline design in critical frames must consider the possible displacements in correspondence of major active or possibly active faults, where sudden permanent deformation could more easily occur. According to Caputo (2005), only large-magnitude earthquakes are capable of generating or modifying the surface morphology instantaneously and permanently (i.e., are linear morphogenic earthquakes). A classic example is the case of the 2002 Denali (Alaska) earthquake, moment magnitude (Mw) = 7.9 (Haeussler et al., 2004). Among some recent events close to the pipeline route are the cases of the 1978 Thessaloniki and 1995 Kozani earthquakes (Caputo et al., 2008). Indeed, earthquake-induced shear, compression, or tension in the ground can strongly affect such buried infrastructures depending on the relative orientation of the pipeline and the fault (Ballantyne, 2008). The worst case occurs when the pipe is affected by pure compression, whereas in the case of tension, steel pipes with welded joints can distribute lengthening over hundreds of meters, thus minimizing localized stresses. According to O’Rourke and Liu (1999), pipeline breakage can occur for relatively small ground displacements (i.e., <12.7 cm [<5 in.]). Empirical formulas such as the ones of Wells and Coppersmith (1994), Ambraseys and Jackson (1998), or S. Pavlides and Caputo (2004) may be used to estimate the surface displacement for events of different magnitudes and fault mechanism.
Thanks to the global navigation satellite system (GNSS), we know that tectonic plates and crustal blocks are in an almost continuous relative movement, most pronounced in the narrow zones between plates. By repeatedly measuring the distances between particular points, we can determine the movement along faults or between plates, the rate, and the likely areas of strain accumulation (Lisowski et al., 1990; R. E. Reilinger et al., 1997; Mantovani et al., 2001; Wright et al., 2001; Cenni et al., 2012; Caporali et al., 2018). Plate boundaries move with variable velocities, from a few millimeters to some centimeters per year (from hundredth to tenth of an inch), implying significant total displacements in 50 yr (e.g., Altamimi et al., 2012). Even without the occurrence of strong earthquakes, a pipeline crossing active plate boundaries must cope with remarkable differential motions along its length because of the interseismic elastic strain accumulation within the upper crust. Such movements, leading to permanent ground deformation (PGD), can distress the pipe, whereas the anchor points can result in local stress concentrations.
The Southern Gas Corridor (SGC) is a significant infrastructure project for the construction of a pipeline that will transport natural gas coming from the fields of Shah Deniz II in Azerbaijan to the Italian Coast for distribution in central and southeastern Europe. The final step of the SGC project (in the following, SGC–Trans Adriatic Pipeline [TAP]), starting at the Turkey–Greece border, running through Greece and Albania, and, after passing beneath the Adriatic Sea, ending in Southern Italy, will be occupied by the TAP. The total length of the pipeline will be 870 km (540.6 mi), of which 545 km (338.6 mi) run in Greece, 211 km (131.1 mi) in Albania, 105 km (65.2 mi) across the Adriatic Sea, and 8 km (5 mi) in Italy.
The SGC–TAP crosses one of the most active zones of the Mediterranean, with many active faults (Caputo et al., 2012; Caputo and Pavlides, 2013; Ganas et al., 2013) and intense seismic activity (e.g., Papazachos and Papazachou, 1997). Several studies previously performed in the area crossed by the pipeline and, based on GNSS observations, evidenced a complex pattern of deformation velocities (e.g., Altiner et al., 2006; Pérouse et al., 2012; Devoti et al., 2017). By collecting and homogenizing the measurements throughout the Calabrian Arc, Balkans, Aegean, and Anatolia peninsula, the modeled velocity field shows a first-order distribution, characterized by two opposite toroidal crustal patterns, clockwise in northwestern Greece and counterclockwise in western Anatolia (Pérouse et al., 2012). On a smaller scale, however, differential motions between blocks separated by major faults or distributed shear zones can also be recognized (Jouanne et al., 2012).
The present study focuses on predicting the areas where critical differential motions could be expected along the SGC–TAP route, over the nominal pipeline lifespan of 50 yr. Based on recent tests on pipelines of 760 mm (30 in.), O’Rourke and Liu (2012) hypothesize that a total displacement of only 76–102 mm (3–4 in.) could cause the tearing of the pipe wall. The analysis of various cast-iron pipeline breakages evidences how the normalized pipe break rate is a nonlinear function of the PGD, with a faster rate for displacements smaller than 12.7 cm (<5 in.). Most of the breakages of pipelines occur for values approximately 50 mm (∼1.97 in.), apparently overall for compressional faulting and vertical displacements (Porter et al., 1991; O’Rourke and Liu, 1999). Pour-Ghaz et al. (2018) indicate that for segmental plain– and steel fiber–reinforced concrete pipelines, subjected to permanent ground displacement, the damage cracking in the immediate vicinity of the fault line begins with as little as 50 mm (1.97 in.) of displacement.
To identify the areas of the SGC–TAP where critical differential motions can most likely occur, we followed two approaches. The first one (continuum approach) considers a continuous crust not affected by faults; the second one (blocky approach) assumes a crust consisting of separate blocks, each one characterized by a relatively uniform tectonic style and behavior. We carefully analyzed the available GNSS data and compared the geodetic results to the pattern of the most significant mapped faults affecting the area (e.g., Caputo and Pavlides, 2013) for assessing the tectonic style and behavior along the route. Then, we processed the GNSS velocity data. In the continuum approach, the sparse, available strain rate information is interpolated along the pipeline route with a linear approach, considering the region as a continuum. In the blocky approach, we instead applied an original algorithm that allows the linear interpolation within individual blocks, characterized by a relatively homogenous strain velocity, or a specific tectonic setting, independently upon the neighboring ones. One of our aims is verifying the efficiency of an interpolation, driven by the knowledge of tectonic domains, and the local consistency of the velocity solutions. The results of the two methods are finally compared by calculating the maximum displacement that would cumulate in the next 50 yr of the pipeline lifespan and, for the blocky approach, the differential displacements that could cause possible bending phenomena to the pipeline structure.
REGIONAL FRAMEWORK
Geodynamics of the Area
From a geodynamic viewpoint, the broader investigated area spans the Apulian plate, crosses the Hellenides fold–thrust belt, and reaches, to the east, the southern Balkans–Northern Aegean extensional province. Apulia is often considered as a promontory of the African (Nubian) plate, and it is currently moving to the north-northeast (e.g., Devoti et al., 2011). The Hellenic orogen is the result of the polyphase convergence between Gondwana and Eurasia, locally oriented southwest-northeast, which has been active from the Mesozoic. The process of oceanic subduction of the Nubian plate beneath the Eurasian southern margin has led to a nappe stacking of the several interposed microcontinents and oceanic basins characterizing the Neo-Tethyan ocean (e.g., Biju-Duval et al., 1977; Şengör, 1985; Robertson et al., 1991; Papanikolaou, 2013). As a result, tectonic transport and imbrication of structures to the south-southwest has occurred since the Early Jurassic, with the progressive involvement of more external terranes and associated development and/or rejuvenation of contractional, northwest-southeast–striking structures (e.g., Jacobshagen, 1986; Mountrakis, 2006; Papanikolaou, 2013).
Along the Albanian and the northwestern Greek sectors of the convergence front (northwest of the Cephalonia transform fault; Figure 1), the subduction of the oceanic lithosphere ended in the late Eocene–early Oligocene (Royden and Papanikolaou, 2011). Slow continental collision, that is, 5 mm/yr (0.2 in./yr) as a long-term average, has been occurring until the present. However, in the back-arc region, widespread extension began since the late Eocene–early Oligocene for the Internal Hellenides (Circum Rhodope and Axios-Vardar zones) and since early Miocene for the External Hellenides (Pelagonian, Pindos, Ionian; Mercier et al., 1979a, 1989; Mountrakis, 2006). In the beginning, the crustal stretching was oriented east-northeast–west-southwest, therefore suggesting the occurrence of a postorogenic collapse (Mercier, 1976; Mercier et al., 1989; Caputo and Pavlides, 1993) or gravitational spreading (Le Pichon and Angelier, 1979). However, the onset of the current stress field for the Aegean Sea region and the central-eastern part of northern Greece characterized by an almost north-south maximum tensile direction, with a slight deflection of the trajectories toward north-northwest–south-southeast in northwestern Greece, can be traced back to the Pleistocene (late Pliocene).
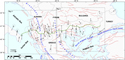 Figure 1. Horizontal global positioning system velocities (gray arrows) and corresponding error ellipses (gray ellipses) used in the present research. The Southern Gas Corridor–Trans Adriatic Pipeline route is in green; primary seismogenic structures affecting the broader investigated area are simplified as red lines. Details on the Nubia–Eurasia rotation pole are in Pérouse et al. (2012). CTF = Cephalonia transform fault; FYROM = former Yugoslav Republic of Macedonia.
An additional element for the comprehension of the tectonics of the northern Aegean Region is the propagation of the dextral strike-slip North Anatolian fault zone (McKenzie, 1972) into the Aegean Sea, where it generates the North Aegean trough (see Koukouvelas and Aydin, 2002 for a review on the geometry and architecture of the North Aegean trough). Such a dextral shear motion across the Aegean Region likely started in the early Pliocene (Armijo et al., 1996), progressively propagating westward.
The current geodynamic setting of the area crossed by the SGC–TAP is characterized by tectonic elements belonging to either compressional, extensional, or transcurrent regimes (e.g., Caputo et al., 2012; Figure 1). More specifically, the western sector around the Albanian shoreline and the southern Adriatic Sea is characterized by both offshore and onshore east-northeast–dipping low-to-medium dip angle active thrusts (Figure 2). Along the highlands of the Albanides, a sudden change of the stress field occurs in terms of a likely swap between the stress tensor components (maximum [σ1] and minimum [σ3] principal stresses), and, as a result, dip-slip kinematics on north-south–striking normal faults is observed (Copley et al., 2009). Moving farther to the east into the western Macedonia region (Greece; Figure 1), the direction of the stress component σ3 slightly rotates, becoming northwest-southeast (e.g., Mercier et al., 1989; Mountrakis, 2006), and the main tectonic structures are represented by southwest-northeast–striking normal faults (S. B. Pavlides and Mountrakis, 1987; Doutsos and Koukouvelas, 1998; Goldsworthy and Jackson, 2000; Doutsos et al., 2006; Caputo et al., 2012 and references therein). Farther to the east (Figure 3), the Thessaloniki and Mygdonian Graben region is subjected to a north-south extension on mainly east-west–striking dip-slip normal faults (e.g., Hatzfeld et al., 1987; Mountrakis et al., 1996a, b; Goldsworthy et al., 2002). Lastly, west-southwest–east-northeast– and east-west–striking normal– and oblique-slip faults characterize southern Thrace and the region close to the border with Turkey. The oblique-slip faults mainly exhibit dextral kinematics, thus suggesting the likely influence of the North Aegean trough on the regional stress field (e.g., Mountrakis et al., 2006; Caputo et al., 2012).
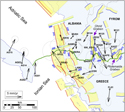 Figure 2. Zoom on the western part of the route showing the global positioning system velocities (black arrows) and relative errors (ellipses). The yellow polygons represent the horizontal projection of the seismogenic sources provided in Greek Database of Seismogenic Sources (Caputo and Pavlides, 2013), where the thick border indicates their upper tip projection (red, green, and blue correspond to a prevailing reverse, strike-slip, and normal kinematics, respectively). For the sake of graphical simplicity, the seismogenic sources cited in the text are labeled with only the numerical part, whereas the country code (AL and GR) and the source code (CS for composite source or IS for individual source) are omitted. Location map in Figure 1. The purple arrows indicate the Ohrid Graben and the Ptolemaida Graben, cited in the text. Details on the Nubia–Eurasia rotation pole are in Pérouse et al. (2012). Black labels are global navigation satellite system station names. AG = from D’Agostino et al. (2008, 2011); FL = from Floyd et al. (2010); FYROM = former Yugoslav Republic of Macedonia; M = from Kotzev et al. (2006); RE = from Reilinger et al. (2006).
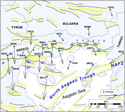 Figure 3. Zoom on the eastern part of the route showing the global positioning system velocities (black arrows) and relative errors (ellipses). Location map in Figure 1. The yellow polygons represent the horizontal projection of the seismogenic sources provided in Greek Database of Seismogenic Sources (Caputo and Pavlides, 2013), where the thick border indicates their upper tip projection (red, green, and blue correspond to a prevailing reverse, strike-slip, and normal kinematics, respectively). For the sake of graphical simplicity, the seismogenic sources cited in the text are labeled with only the numerical part, whereas the country code (AL and GR) and the source code (CS for composite source or IS for individual source) are omitted. Black labels are global navigation satellite system station names. FYROM = former Yugoslav Republic of Macedonia; MA = from Matev (2011); NAFZ = North Anatolian fault zone; RE = from Reilinger et al. (2006).
During the last decade, several sectors of the investigated area were monitored by both permanent GNSS networks and repeated campaigns on temporary stations. The resulting velocity data constitute the input for geodynamics and regional strain field models.
Along the Adriatic Sea, we record 3–5 ± 1 mm/yr (0.1–0.2 ± 0.03 in./yr), in the northeast direction in the Apulia area (Devoti et al., 2011). High velocity (8–10 mm/yr [0.3–0.4 in./yr]) is also recorded in some islands in central Adria between the Gargano zone and the central Dinarides, with northeast-oriented vectors (Altiner et al., 2006). Across the Adriatic Sea, the subduction of the Adria microplate under the Dinarides–Albanides causes a velocity drop of 8.7 ± 0.5 mm/yr (0.3 ± 0.02 in./yr) in 200 km (124.3 mi). On the eastern side of the Adriatic Sea, the velocity field is characterized by a south-westward motion of the external Albanides increasing from north to south and by a southward velocity of the inner Albanides, former Yugoslav Republic of Macedonia (FYROM), Bulgaria, and northern Greece increasing from north to south (Jouanne et al., 2012; Figure 1). The major dextral strike-slip faults in Albania are associated with an inversion of the velocity parallel to the coastline of 7.1 ± 0.5 mm/yr (0.3 ± 0.02 in./yr) occurring in 350 km (217.5 mi) (Caporali et al., 2009).
The subduction along the Hellenic Arc dominates the tectonic deformation in the study area (Papazachos, 1988; Wortel et al., 1990), with a 30.5 mm/yr (1.2 in./yr) mean southwestward motion roughly perpendicular to the west Hellenic trench. We record 20.6 ± 0.8 mm/yr (0.8 ± 0.03 in./yr) in eastern and central Turkey, 24.6 ± 1.0 mm/yr (9.7 ± 0.04 in./yr) in western Turkey, and up to 31.1 ± 0.9 mm/yr (1.2 ± 0.04 in./yr) in the central and southern Aegean (R. Reilinger et al., 2006; Devoti et al., 2017). Eastern Macedonia and Thrace in northern Greece are affected by the stretching of the upper crust, with a relative velocity up to 3.2 ± 0.9 mm/yr (0.1 ± 0.04 in./yr) in 440 km (273.4 mi) (Caporali et al., 2009).
Seismogenic Structures
In the following section, we briefly analyze the primary active fault zones close to and crossing the pipeline path, moving from the western sector offshore Albania to the eastern termination of the investigated area at the Greek–Turkish border (Figure 1). The principal seismotectonic characteristics, as well as the labels of the structures (Figures 2, 3), are from the Greek Database of Seismogenic Sources (GreDaSS) (Caputo and Pavlides, 2013; http://gredass.unife.it), to which the reader is referred to for the relevant references.
The first tectonic structure crossed by the pipeline path is the Karaburuni–Sezani detachment (Albania Composite Source [ALCS]201 in GreDaSS; Figure 2) described as an east-northeast–dipping, low-angle, reverse fault. Although the maximum expected earthquake has been estimated to have an Mw greater than 7.0 (Caputo and Pavlides, 2013), the scarce instrumental and historical seismicity available for this structure leaves some uncertainties on the possible occurrence of internal segmentation, as well as on the slip rate and recurrence time of each segment. Once on land, the route crosses other reverse structures such as the Ardenica back thrust (ALCS235) and the Osum thrust (ALCS240). The former is a secondary fault with a small seismogenic potential, whereas the possible activity of the latter as an out-of-sequence structure is still debated, although the faults could be capable of generating moderate events. Because of their overall dimensions, setting, kinematics, and location, it is doubtful that the associated earthquakes could be linear morphogenic ones (Caputo, 2005).
It is noteworthy that the Albanides convergence front is segmented along its roughly north-south–trending strike by some significant transverse faults, with prevailing transcurrent kinematics and transfer role, such as the Shkodra (ALCS390), Lushnje (ALCS290), and Qeparo Transfer faults (ALCS085) (Figure 2). Regarding the SGC–TAP, the closest among these structures is the Lushnje Transfer fault, striking east-northeast–west-southwest, steeply dipping SSE and characterized by a dextral sense of shear. The maximum magnitude Mw associated with this structure is approximately 6.3 (Caputo and Pavlides, 2013), and the minimum distance from the fault trace is approximately 10 km (∼6.2 mi).
No active faults have been recognized east of Berat (near the GNSS station, BERA, in Figure 2) along the pipeline route and for more than 50 km (>31.1 mi) across the high-topography internal region of southern Albania. Possible stability problems for the pipeline are only and basically of geotechnical concern. Toward the border with the FYROM and Greece, the most relevant active tectonic structures are represented by an 80-km-long (47.7-mi-long) fault system, forming the roughly north-south Ohrid Graben, which locally accommodates east-west crustal extension (Figure 2). The pipeline crosses its southern sector and, in particular, the normal faults named Korçë (ALCS515), Podgoritsa (ALCS510), Maliqi (ALCS505), and Bilisht (ALCS520) (Figure 2), whose strike ranges between N330°W and N30°W. The prevailing dip-slip kinematics is documented by structural data and focal mechanisms from moderate magnitude earthquakes (e.g., Muço, 1994; Kiratzi, 2011). A recent confirmation comes from an Mw = 5.1 magnitude event that occurred in June 2019 (https://bbnet.gein.noa.gr/). According to their dimensions and geodynamic setting, all these structures could release moderate earthquakes; however, none of them could likely generate significant direct coseismic ground ruptures at intersection points with the pipeline.
Reaching the Greek territory, the tectonic regime changes once more as far as the Kastoria dip-slip normal fault (Greece Composite Source [GRCS]090) has an east-west orientation, thus documenting a roughly meridian crustal stretching direction. At the same time, eastward, the pipeline enters and crosses all along the northeast-southwest–trending Ptolemaida Graben (Figure 2). This structure is bordered by the Amyndeo (GRCS070), Ptolemaida (GRCS072), and Komanos (GRCS077) composite sources (Figure 2) as well as minor individual sources with faults dipping both northwest and southeast (Caputo and Pavlides, 2013). Their kinematics is mainly dip slip, confirming the change (relative to the western Albanian sector) in the Quaternary stress trajectories that characterizes the broader Aegean Region (e.g., Mercier et al., 1979a, 1989). Based on geological estimates and geodetic data, the slip rates of the Ptolemaida Graben faults are in the order of 0.1–0.3 mm/yr (3.9 × 10⁻³–1.2 × 10⁻² in./yr), suggesting prolonged recurrence times. In contrast, their estimated seismogenic potential in the case of multiple-segment ruptures could be as high as 6.6–6.9 for the Mw (Caputo and Pavlides, 2013).
Moving farther to the east (Figure 3), the stress trajectories and consequently the orientation of the major crustal faults slightly change (10°–20° clockwise rotation), as documented by the South Almopia fault (GRCS068), which is characterized by prevailing dip-slip kinematics with a minor dextral component of motion. The progressive change of the stress trajectories also continues in central Macedonia. The Anthemoundas (GRCS250), Asvestochori (GRCS245), and Mygdonia (GRCS100) composite sources (Figure 3) show dip-slip kinematics, north dipping, and east-west to east-southeast–west-northwest trending. The slip rates of these structures are in the order 0.1–0.4 and 0.1–0.7 mm/yr (3.9 × 10⁻³–1.6 × 10⁻² and 3.9 × 10⁻³–2.8 × 10⁻² in./yr) (e.g., Tranos et al., 2003), and the maximum possible earthquake could be as strong as Mw = 7 (Caputo and Pavlides, 2013). In this regard, the Gerakarou fault (the central segment of the Mygdonia composite source) was responsible for the Mw 6.4 Thessaloniki earthquake of 1978 (Mercier et al., 1979b). It should be noted that north of Thessaloniki, the SGC–TAP turns northeastward; therefore, the infrastructure crosses only the westernmost part of the northern Chalkidiki fault system, where coseismic ground ruptures are likely to be limited, even in case of a future linear morphogenic earthquake.
North of the Chalkidiki peninsula, the pipeline turns eastward, running roughly parallel to the Serres fault (GRCS145; Figure 3) for approximately 50 km (∼31.1 mi) all along its hanging-wall block. This structure dips south- and southwestward as far as it is clearly segmented (Mountrakis et al., 2006). Estimated slip rates are very low (0.05–0.1 mm/yr [1.9 × 10⁻³–3.9 × 10⁻³in./yr]), and no historical earthquakes are reported (Papazachos and Papazachou, 1997). However, in the case of a reactivation of the entire source, the maximum magnitude predicted by empirical relationships should be approximately Mw = 6.7 (Caputo and Pavlides, 2013).
More eastward, the pipeline runs just south of the Drama fault (GRCS140), and then along the hanging-wall block of a significant seismogenic source (Thrace fault zone; GRCS150; Figure 3). It consists of an approximately 120-km-long (∼74.6-mi) structure bordering the Rhodope Massif to the north and the Kavala–Xanthi–Komotini basin to the south (Mountrakis and Tranos, 2004). This composite source is divided into four major segments, but only the three eastern ones show evidence of recent activity (Xanthi [GRCS150a], Iasmos [GRCS150b], and Komotini [GRCS150c] faults; Figure 3). The fault barriers are of an angular type producing marked differences in strike and dip (basically southward) and generating a zigzag geometry. The seismicity is quite low, although long-term slip rates are in the range of 0.2–0.5 mm/yr (7.9 × 10⁻³–2.0 × 10⁻³in./yr). Although the maximum recorded earthquake was in 1784 (Mw = 6.7) (Papazachos and Papazachou, 1997), if we assume the contemporaneous rupture of multiple segments, the estimated maximum magnitude could be even greater than 7 (Caputo and Pavlides, 2013).
In the very final sector of the investigated area, before crossing the border with Turkey, the SGC–TAP runs close to and is potentially affected by the Maronia fault (GRCS160). Such a fault zone strikes almost east-west dipping southward and exhibits slightly oblique-slip kinematics being possibly influenced by the transtensional stress field associated with the nearby North Anatolian fault zone–North Aegean trough system (Figure 3). The minor dextral strike-slip motion component (rake ∼250°–260°) is also confirmed by the analysis of the focal mechanisms (Kiratzi et al., 2005). The associated slip rate is in the range of 0.4–0.7 mm/yr (1.6 × 10⁻³–2.8 × 10⁻² in./yr), and the maximum Mw is approximately 7.0 (Chatzipetros and Pavlides, 2004).
DATA ANALYSIS
One of the primary needs for a study like the present one, involving the comparison, in modulus and directions, of velocities along the entire SGC–TAP, is to deal with a velocity field as homogeneous as possible, reducing the systematic errors arising from different reference frame adoptions. In this regard, Pérouse et al. (2012) performed a considerable work of revision and homogenization of the global positioning system (GPS) velocity data acquired and processed in different sectors of the central and eastern Mediterranean to present a new kinematic and strain model of this broad region. Thanks to their work, a catalog of the displacement velocities, with relative errors, is available and homogeneously calculated compared to a fixed Eurasia (Figure 1). Details on the Nubia–Eurasia rotation pole are in Pérouse et al. (2012). Devoti et al. (2017) made an analogous effort, but the coverage in the area of our interest is much lower.
Based on the catalog of Pérouse et al. (2012), Figure 4 shows a synthesis of the velocities observed in the broader area crossed by the SGC–TAP route, showing two distinct sectors: western and eastern. We averaged the values of the velocities with the same orientation: the color is proportional to the velocity. The western sector, across the southern Adriatic Sea–Albania (Figure 4, ellipse A), is characterized by interplate convergence between Apulia and the External Hellenides–Albanides, as clearly suggested by the opposite velocity vectors on the two coastal areas of the Adriatic Sea (Figures 2, 4). In contrast, the central-eastern sector is affected by a southward positive velocity gradient progressively increasing from 4 to 8 mm/yr (0.2–0.3 in./yr), thus suggesting the internal deformation of the crust, which is undergoing north-south stretching (Figure 4, ellipse B). Farther to the east, the velocities are higher and reflect the counterclockwise rotation of the Anatolian microplate (Figure 4).
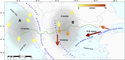 Figure 4. Representative velocity vectors (colored arrows) relative to a fixed Eurasia frame (simplified from Pérouse et al., 2012) in the broader area crossed by the investigated sector of the Southern Gas Corridor–Trans Adriatic Pipeline (green line). The arrow color scale is indicative of the magnitude of the velocities. The gray ellipses mark the area characterized by interplate convergence between Apulia and the External Hellenides (A) and a part of the broader southern Balkan–Northern Aegean Region (B) affected by north-south crustal stretching. Details on the Nubia–Eurasia rotation pole are in Pérouse et al. (2012).
The Data
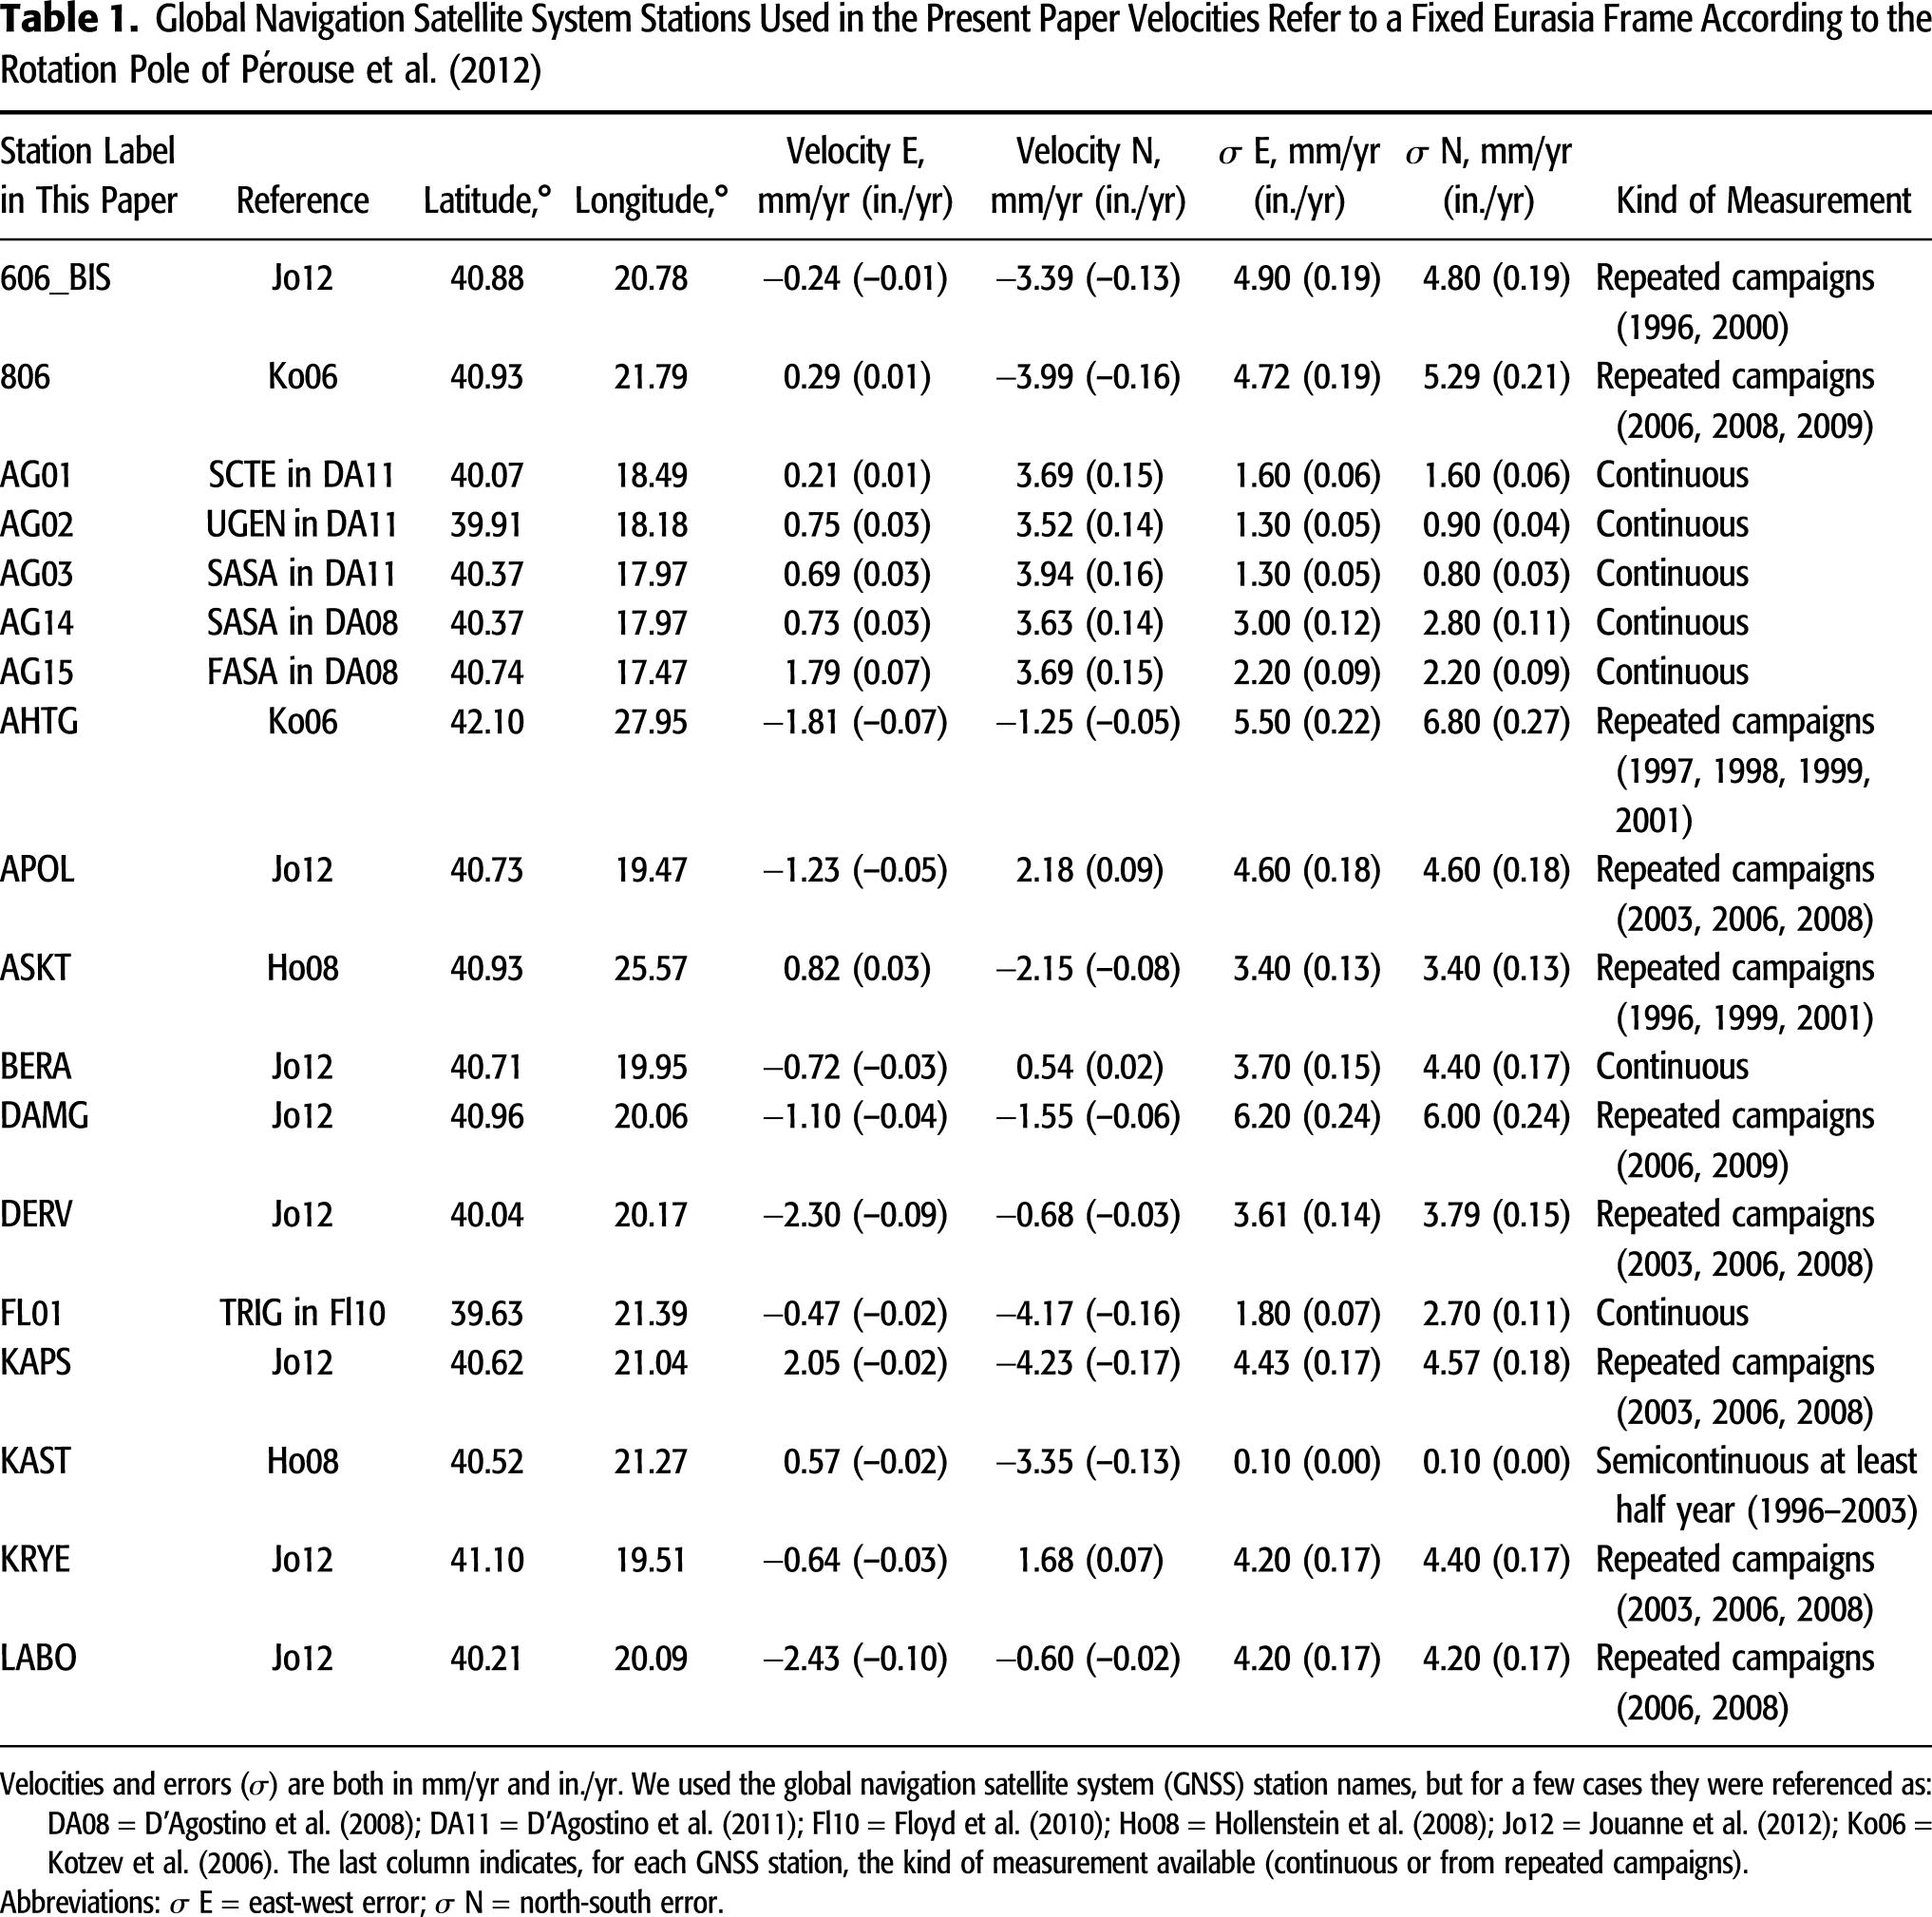
From the catalogs of the GPS measurements provided by Pérouse et al. (2012 and references therein), we selected the data in a buffer zone around the SGC–TAP (Figures 1–3). We gave priority to the data nearest to the pipeline (GPS sites within a distance of ∼120 km [∼74.6 mi]) and/or with the smallest error ellipses (major axis smaller than 6.8 mm [<0.3 in.]). For each station, the accuracy of the measurement was evaluated, considering whether it is a permanent or temporary station, the length of the time series for the permanent sites, or, in the case of a temporary station, the number of repeated measures.
Table 1 summarizes all relevant information used in our analyses. Regarding the station labels, in general, we used the official published ones; in other cases, for simplicity, stations are labeled based on the original papers and numbered sequentially. It is the case of the stations, that the labels indicate information comes from D’Agostino et al. (2008, 2011) AG01, AG02, and AG03 or from Matev (2011) MA01, MA02, and so on. Table 1 also reports the name in the original publication.
Quantitative Analyses
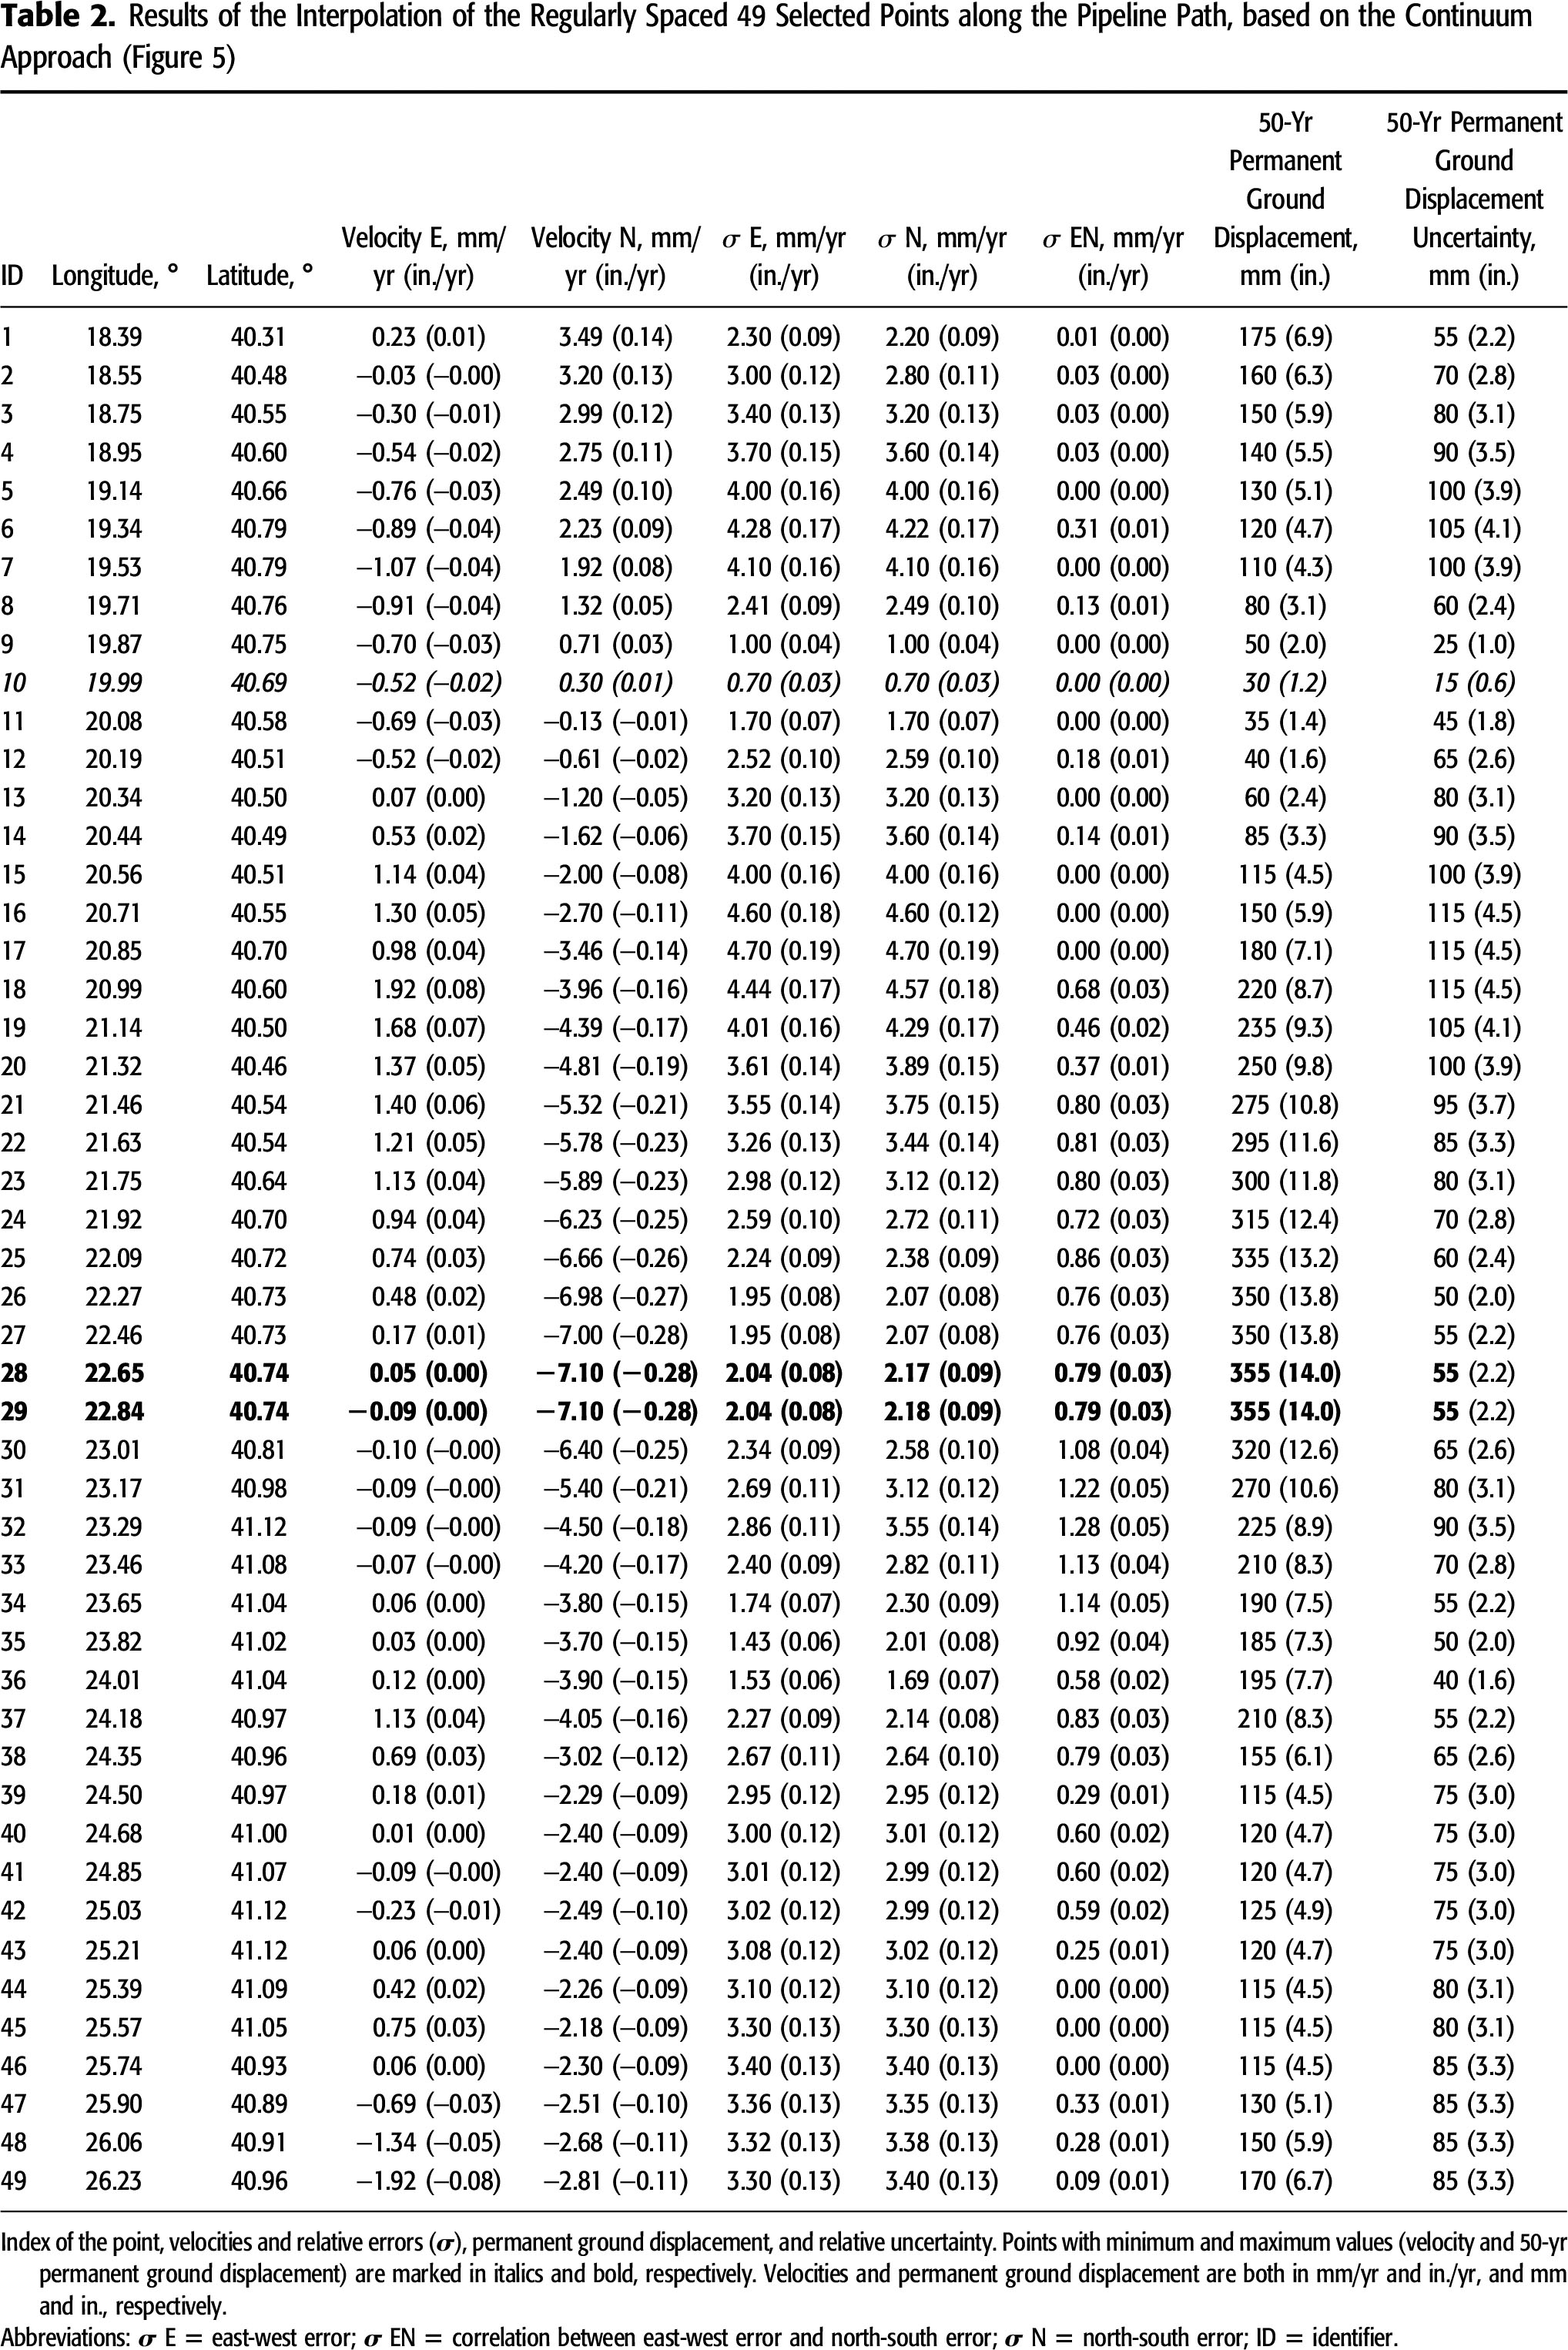
To give a quantitative estimate of the expected displacements along the whole route of the pipeline, we performed a three-dimensional interpolation on the data over equally spaced points (Figure 5). Our scattered data set is defined by locations, (x, y) or (longitude, latitude), and by the corresponding values d. The Delaunay triangulation function of (x, y), yielding the surface F(x, y) = d, has been selected to interpolate the data. The function F has been used to estimate unknown values of di at locations (xi, yi) included in the original (x, y) domain (de Berg et al., 2008; Weisstein, 2010).
 Figure 5. (A) Horizontal velocities (blue arrows) and corresponding estimated errors (gray ellipses) interpolated at closely and equally spaced points along the Southern Gas Corridor–Trans Adriatic Pipeline route (green line) based on the continuum approach. (B) The same map with the original data (gray arrows and ellipses) for reference. Black labels are global navigation satellite system station names. Additional labels are informational references: AG = from D’Agostino et al. (2008, 2011); FL = from Floyd et al. (2010); M = Kotzev et al. (2006); MA = Matev (2011); RE = from Reilinger et al. (2006).
The five-dimensional F interpolating function has been inferred, using a linear method of interpolation, from the following values (or d, as mentioned above): velocity in the east-west direction, velocity in the north-south direction, east-west error, north-south error, and the correlation between the two components.
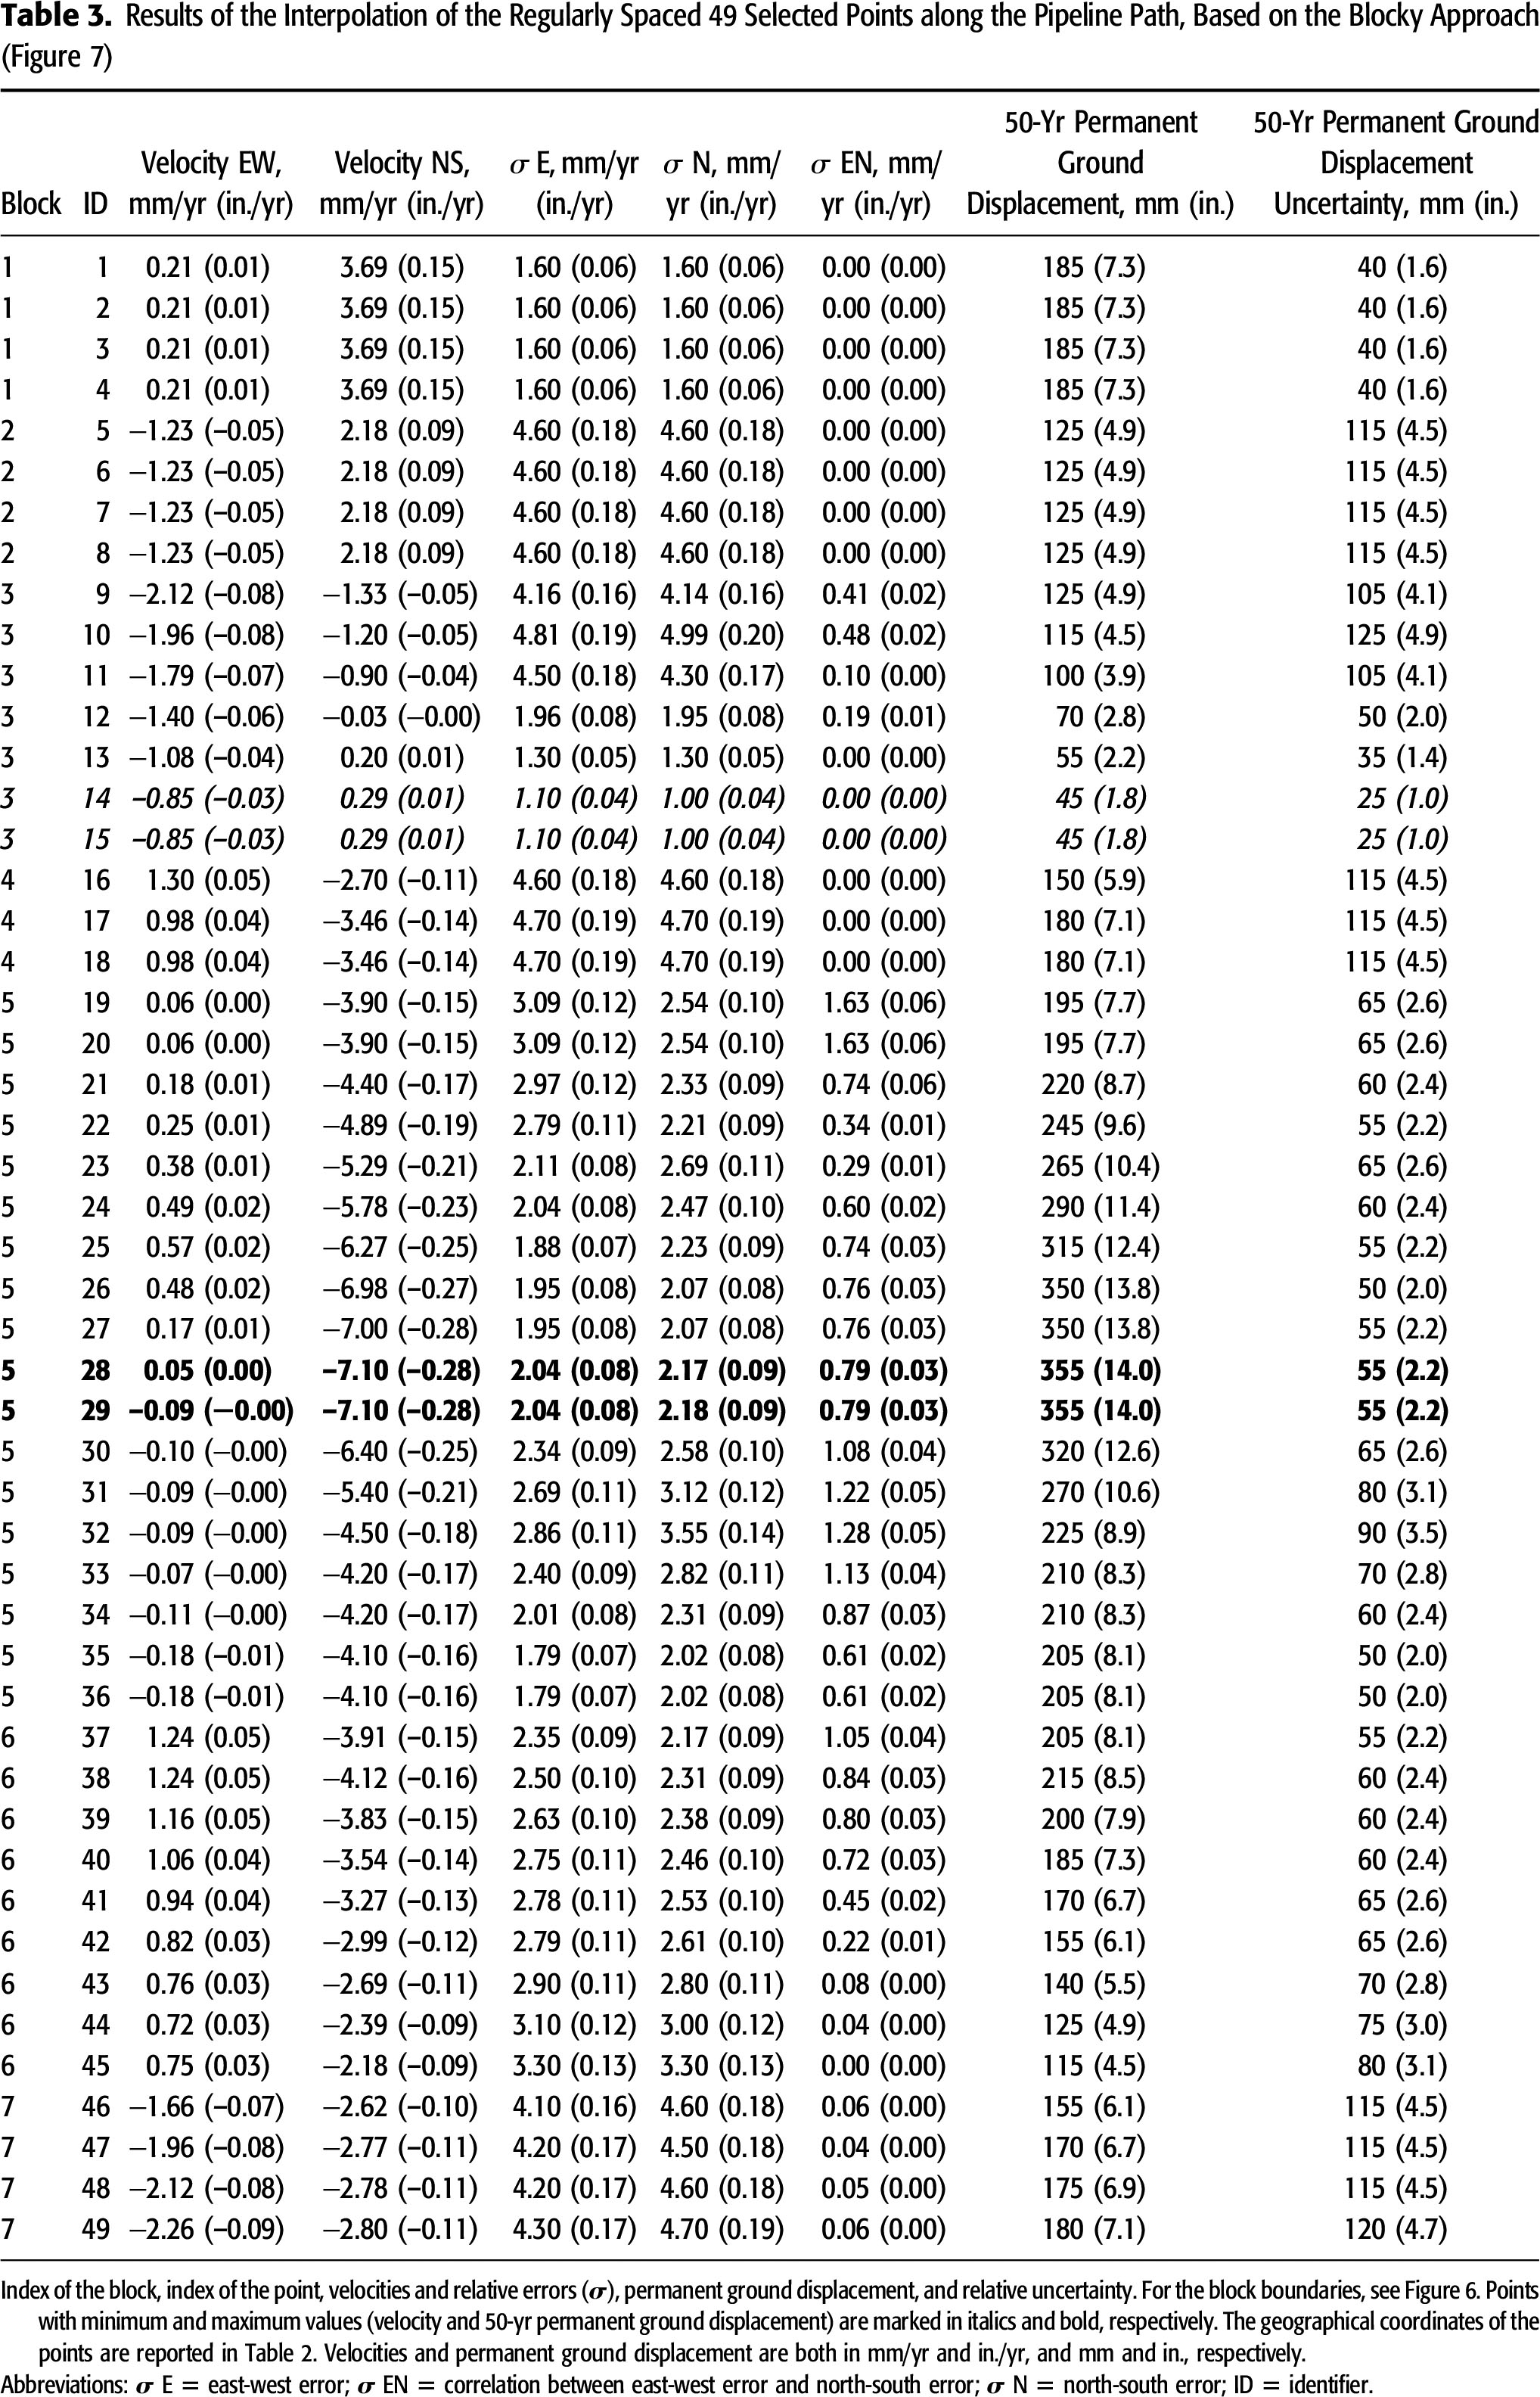
After that, we used the F function to evaluate the corresponding values d over 49 regularly spaced (20 km [12.4 mi]) points along the SGC–TAP route. We followed two approaches: (1) a continuum approach along the whole path and (2) a blocky approach, in which the F functions are calculated within distinct crustal blocks, showing an independent behavior. As mentioned above, such blocks are characterized by roughly uniform velocity trends markedly delimited and/or associated with different faults (Figure 6). With both approaches, we linearly interpolated all the available measurements within a distance of 120 km (74.6 mi) from the SGC–TAP route, weighted for the distance from the path.
 Figure 6. Gray dashed lines represent the boundaries between the blocks assumed to have relatively homogenous geodetic behavior and used in the blocky approach. Each block is indicated with a black number in a circle. Gray arrows indicate the global positioning system velocities with their relative errors ( gray ellipses). Red lines represent the simplified upper tip of the seismogenic sources (Figure 1). Black labels are global navigation satellite system station names. Additional labels are informational references: AG = from D’Agostino et al. (2008, 2011); FL = from Floyd et al. (2010); M = Kotzev et al. (2006); MA = Matev (2011); RE = from Reilinger et al. (2006).
Based on the velocities inferred employing the two approaches, we also calculated the cumulative displacements, with the relative uncertainties, expected in the 50 yr representing the average life of this kind of energy infrastructure.
Continuum Approach
Figure 5A shows the results of the data continuum interpolation. The horizontal velocities reconstructed by the interpolating algorithm and the relative errors have a good match with the observations (Figure 5B). The GNSS station, KAST, with a minimal error ellipse and very near to the SGC–TAP, ensures smaller error ellipses in the central part.
Shown in Table 2 are the velocity values obtained, with the relative errors and displacements expected after 50 yr, with the corresponding uncertainty. As mentioned above, all velocities are relative to fixed Eurasia (details on the Nubia–Eurasia rotation pole are in Pérouse et al., 2012). The minimum velocity and, hence, the expected minimum displacement, is recorded at the 10th interpolation point, in Albania, Berat district, near the city of Poliçan, with a velocity value of 0.6 mm/yr (0.02 in./yr), implying a predicted total displacement in 50 yr of only 30 mm (1.2 in.). However, the maximum velocity and displacement are recorded at the 28th and 29th points of the interpolation in Greece near the city of Chalkidona, 15–30 km (9.3–18.6 mi) northwest of Thessaloniki and to the southeast of the South Almopia fault (GRCS068), with values of 7.1 mm/yr (0.3 in./yr), implying a cumulative displacement of 355 mm (14 in.) in 50 yr, with an uncertainty of 55 mm (0.4 in.).
Blocky Approach
The blocky approach aims to highlight the existence of discontinuities in the deformation field. Distinct blocks and their relative boundaries (Figure 6) have been recognized by taking into account (1) the traces of the primary active faults (Caputo and Pavlides, 2013 and references therein) and the general geodynamic setting of the region; (2) in the absence of recognized tectonic structures, the relief characteristics that could justify a change in the observed horizontal velocities; and (3) the occurrence of homogeneous GPS clusters. The ensuing uncertainty in the position of the block boundaries, and, hence, of the differential displacements occurring, can be estimated to be in the order of 10–20 km (6.2–12.4 mi), comparable to the distance between two subsequent points.
Block 1 includes the Apulia and part of its offshore (Figure 2); block 2 incorporates the Karaburuni–Sezani detachment (ALCS201 in GreDaSS), the Ardenica back thrust (ALCS235), and the Shkodra (ALCS390), Lushnje (ALCS290), and Qeparo Transfer faults (ALCS085). At the same time, the Osum thrust (ALCS240) marks its boundary with block 3, which occupies the westernmost part of Albania (Figure 2). Block 4 includes the normal faults Korçë (ALCS515), Podgoritsa (ALCS510), Maliqi (ALCS505), and Bilisht (ALCS520) (Figure 2). The central part of the corridor falls almost entirely within block 5, characterized by a relatively homogeneous velocity field with roughly southward vectors. It is worth noting that the western sector of this block is affected by northeast-southwest–trending faults (Kastoria fault [GRCS090] and Ptolemaida Graben with the Amyndeo [GRCS070], Ptolemaida [GRCS072], and Komanos [GRCS077] composite sources) (Figure 2). In the remaining part of the same block, the major crustal faults are nearly east-west (i.e., South Almopia fault [GRCS068], Anthemoundas [GRCS250], Asvestochori [GRCS245], and Mygdonia [GRCS100] composite sources; Gerakarou fault [GRIS101]; and Serres fault [GRCS115]) (Figure 3). However, considering that all selected velocity vectors included in the block are almost parallel and the western part contains only two stations, we decided not to subdivide block 5 further. Block 6 includes the primary seismogenic source of the Thrace fault zone (GRCS150) as well as some other structures in southern Bulgaria. Finally, the easternmost block 7, including the region from Thassos to the Black Sea, is clearly influenced by the westward motion of the Anatolia microplate. It includes the Maronia fault (GRCS160) and the set of structures belonging to the North Aegean trough (Figure 3).
Based on the blocks shown in Figure 6, we group the stations into clusters, where we linearly interpolate the velocity. When the data coverage is not sufficient (generally toward the block boundaries), we fill the gaps with the last reliable value obtained. Hence, for the first two blocks, we use the nearest-neighbor interpolation algorithm so that we merely extend offshore the most reliable information we have on the coast. For the other blocks, the velocities are linearly interpolated within the block, weighting the data for their distance from the pipeline route. This procedure implies sudden changes at the boundaries of the blocks.
To safely interpolate the velocities and relative errors, we applied the same algorithm used in the continuum approach but using only the GNSS stations within every single block (indicated with different colors in Figure 7). In this way, where abrupt changes occur in the velocity distribution (Figure 7A), no intermediate orientations are artificially created in the interpolated points, and the pattern characterizing each separate block is better preserved. For facilitating a comparison between the two approaches, we applied the procedure to the same equally spaced points along the SGC–TAP route. Reported in Table 3 are the obtained velocity values (with the relative coordinates and uncertainties) as well as the estimated displacements after 50 yr (with their uncertainties). The minimum cumulative displacement is recorded at the 14th interpolated point in Albania in block 3 at the boundary between the Berat and the Korçë districts, near Lekas town. The maximum, instead, is recorded at the 28th interpolated point in Greece in block 5, 25 km (15.5 mi) to the northwest of Thessaloniki, to the southeast of the South Almopia fault (GRCS068) (i.e., nearly coinciding with the results of the continuum approach), with the same value of 7.1 mm/yr (0.3 in./yr), resulting in 355 mm (14 in.) in 50 yr, and uncertainty of 55 mm (0.4 in.).
 Figure 7. (A) Horizontal velocities (colored arrows) and corresponding estimated errors (colored ellipses) interpolated at equally spaced points along the Southern Gas Corridor–Trans Adriatic Pipeline route (green line) based on the blocky approach (the points belonging to each of the blocks of Figure 6 are indicated with the same color: brown [block 1]; blue [block 2]; red [block 3]; dark green [block 4]; green [block 5]; magenta [block 6]; violet [block 7]). (B) The same map with the original data (gray arrows and ellipses) for reference. Black labels are global navigation satellite system station names. Additional labels are informational references: AG = from D’Agostino et al. (2008, 2011); FL = from Floyd et al. (2010); M = Kotzev et al. (2006); MA = Matev (2011); RE = from Reilinger et al. (2006).
DISCUSSION
Comparing the information available on the major active faults affecting the region to the one obtained from the analysis of the GPS measurements could contribute to discriminating between faults that separate blocks with a nearly homogeneous behavior from other tectonic structures that do not affect the horizontal velocities among blocks. For this purpose, a geographic information system was utilized to analyze the velocity measurements in connection with the primary active faults affecting the investigated region (Caputo and Pavlides, 2013; Figure 1).
By examining the velocity distribution, it is possible to recognize areas characterized by a homogeneous pattern and other ones where abrupt velocity changes occur, both in module and direction, thus suggesting the kinematic effect of major active tectonic structures. For example, whereas Apulia is rigidly moving toward the north-northeast (AG01, AG02, AG03, AG14, and AG15 sites), the GPS stations on the Albanian shoreline (GNSS stations KRYE, APOL, and RRAD) point toward the north-northwest (Figure 2). The strain velocities in the internal region of southern Albania (GNSS stations LABO, DERV, and LESK) are perfectly parallel to the west-southwest direction of convergence, as documented by the slip vectors on the principal thrusts (Muço, 1994; Louvari et al., 2001; Serpetsidaki et al., 2012). This remarkable difference in the direction from the coastal to the internal sector is likely because of a strong mechanical coupling characterizing the Karaburuni–Sezani detachment (ALCS201) and the Durresi Offshore thrust (ALCS315). These structures represent the basal decollement of the accretionary wedge in this sector of the orogen. Therefore, the north-northeast motion of the underlying Adria plate is partly transmitted to the overlying wedge and, hence, up to the topographic surface (viz. geodetic stations). The seismogenic potential and the persisting activity of the accretionary wedge are also clearly documented by the damaging earthquake with an Mw of 6.4 (November 26, 2019; https://bbnet.gein.noa.gr/) whose causative fault is still under investigation and should correspond to the Durresi thrust (ALCS315; Figure 2).
In central Albania, in a more internal sector of the orogen, the crustal rheological conditions allow the formation of a sufficiently thick, weak, and ductile layer between the upper and lower plates (Maggini and Caputo, 2020). Here, the measured GNSS velocities are more consistent with the overall kinematics of this sector of the southern Balkan peninsula, reflecting a nearly south-southwest direction of motion (GNSS stations MUSH, LIXH, DAMG, and M124 in Figure 2).
Close to the Albanian–FYROM border, there is further change in orientation of the relative movements as far as all stations point south to south-southeastward (Figure 2). At a first approximation, this different pattern somehow reflects the crustal stretching pervading the broader Aegean Region (Figure 4). However, if we analyze in more detail the cluster of GNSS stations located in southwest FYROM and east Albania, it is possible to observe some divergence among the western (606_BIS and RE02) and eastern (POGR and KAPS) stations (Figure 2). Such behavior suggests, therefore, that some amount of east-west extension is presently occurring, associated with the activity of the normal faults belonging to the Ohrid Graben (Figure 2).
Regarding the other GNSS stations in continental northeastern Greece and Bulgaria, the southward direction of the velocity vector is more stable. In this sector of the investigated area, it is worth emphasizing that the modules markedly increase southward, being more than double in Chalkidiki (MA10 or MA08) compared to the stations PECH and MA03 or MOMC, close to the border between Greece and Bulgaria (Figure 3). These differences in the velocity confirm the ongoing north-south extension that occurs in the region, which is likely accommodated by the several roughly east-west–trending normal faults described in a previous section.
Finally, GNSS stations in Thassos and Samothraki islands and Turkish Thrace (THAS, SMTK, and RE01) bear a significant westward component of motion likely caused by the drag effect likely induced by the lithospheric dextral shear zone separating Europe from the Anatolian plate (Figure 3).
These observations suggested verifying the suitability and efficiency of an interpolation, driven by the knowledge of tectonic domains, and the local consistency of the velocity solutions in comparison to a standard continuum approach. Hence, we used an interpolation based on the Delaunay triangulation because of its fastness and low memory requirement for computation (e.g., Khatri Chhetri and Zafar, 2013) and the easiness of implementation in other contexts; additionally, it is robust, well tested, and of widespread use. A future improvement of the procedure will employ more rigorous methods, such as the weighted least-squares method, or kriging. For both approaches, we interpolated the data on 49 points, spaced 20 km (12.4 mi). This value is the maximum possible detail that could be reasonably obtained within the investigated area because of the data spacing between the available GPS stations, mostly in the range of 20–40 km (12.4–24.9 mi). For the blocky interpolation, we subdivided the GPS velocity data into clusters related to different tectonic blocks. By comparing Figures 5 and 7, the block subdivision method, compared to the continuum approach, highlights the strain velocity lateral variations bound to different tectonic regimes. We can also observe a better fit between the interpolated velocities with the original observations, like in Thrace, the neighboring of the Anatolia plate boundary, and the Albanian region (Figures 5B, 7B).
The location of the minimum and maximum displacement expected along the corridor slightly varies with the two approaches. In the first case, the minimum is recorded in Albania, Berat district, near the city of Poliçan (Figure 5), with values of 0.6 mm/yr (0.02 in./yr) for the velocity, implying a total displacement in 50 yr of only 30 mm (1.2 in.) (Table 2). With the second approach, the minimum velocity is obtained in Albania, but slightly to the east, close to the Ohrid Graben structure (Figure 7). For both approaches, the maximum expected ground displacement should be of 355 mm (14 in.) in 50 yr, between South Almopia (GRCS068) and Anthemountas (GRCS250) faults (Figures 5, 7), near Chalkidona (Greece).
However, for a pipeline integrity study, it is more crucial to recognize the sections where bending strains may occur. Research on the amount of permanent ground displacement causing pipeline breakage and the defensive measures is continuously improving based on new data and modeling. Based on the results reported by Porter et al., (1991), O’Rourke and Liu (1999), and Pour-Ghaz et al. (2018), a value of permanent ground displacement of 50 mm (1.97 in.) is the minimum value for the onset of damage and cracking. Recent tests on pipelines of 760 mm (30 in.) indicate a total displacement of 76–102 mm (3–4 in.) as the cause of the pipe wall tearing (O’Rourke and Liu, 2012). Hence, since the SGC–TAP will have a diameter of 122 cm (48 in.) for the onshore and 91 cm (36 in.) for the offshore section, we take as a threshold for the permanent ground displacement leading to pipe wall damage 100 mm (3.9 in.).
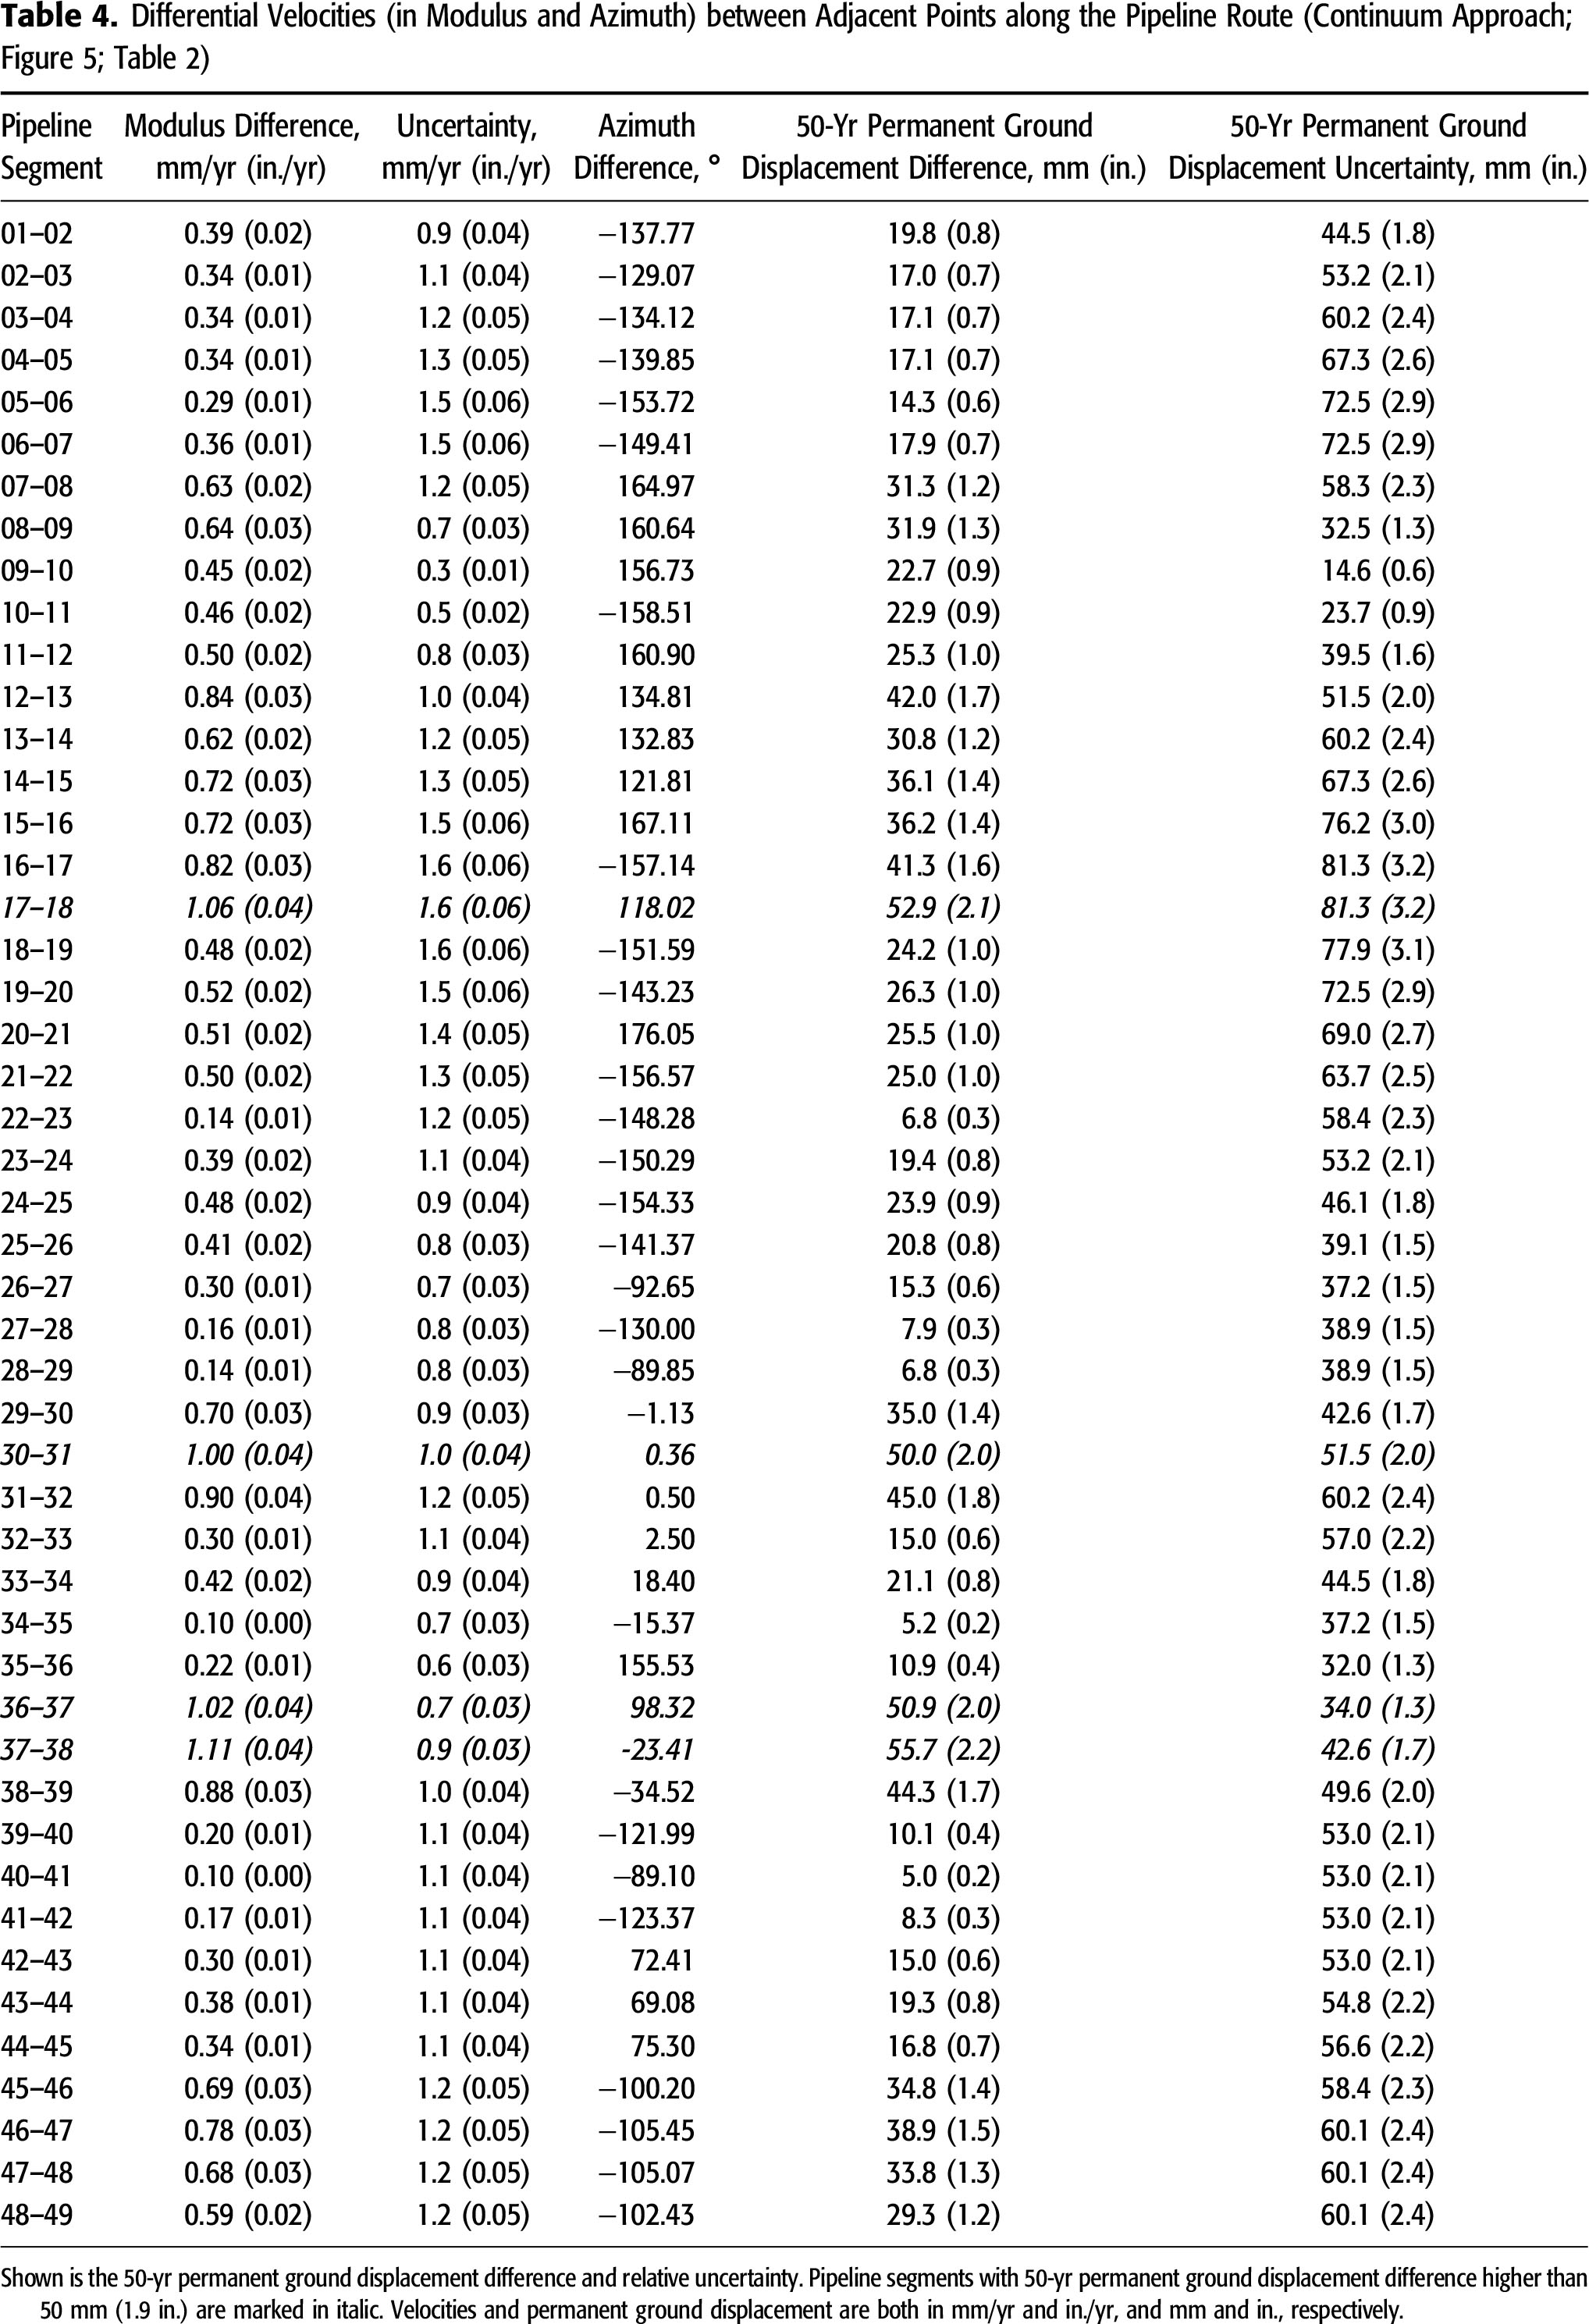
To identify possible bending strain points, we also calculated the difference between adjacent points along the SGC–TAP, from west to east (i.e., from Apulia to Turkey). Tables 4 and 5 report the results for the continuum and blocky approach, respectively. In the former case, the differential displacements are, necessarily, minimal as far as the interpolation over the whole route minimizes the relative differences. Nevertheless, the conservative threshold of 50 mm (1.97 in.) is exceeded between the points 17 and 18 (across the Ohrid Graben, Albania), 30 and 31 (between the Mygdonia [GRCS100] and Serres [GRCS145] composite sources), 36 and 37, and 37 and 38 (south of the Drama fault; GRCS140).
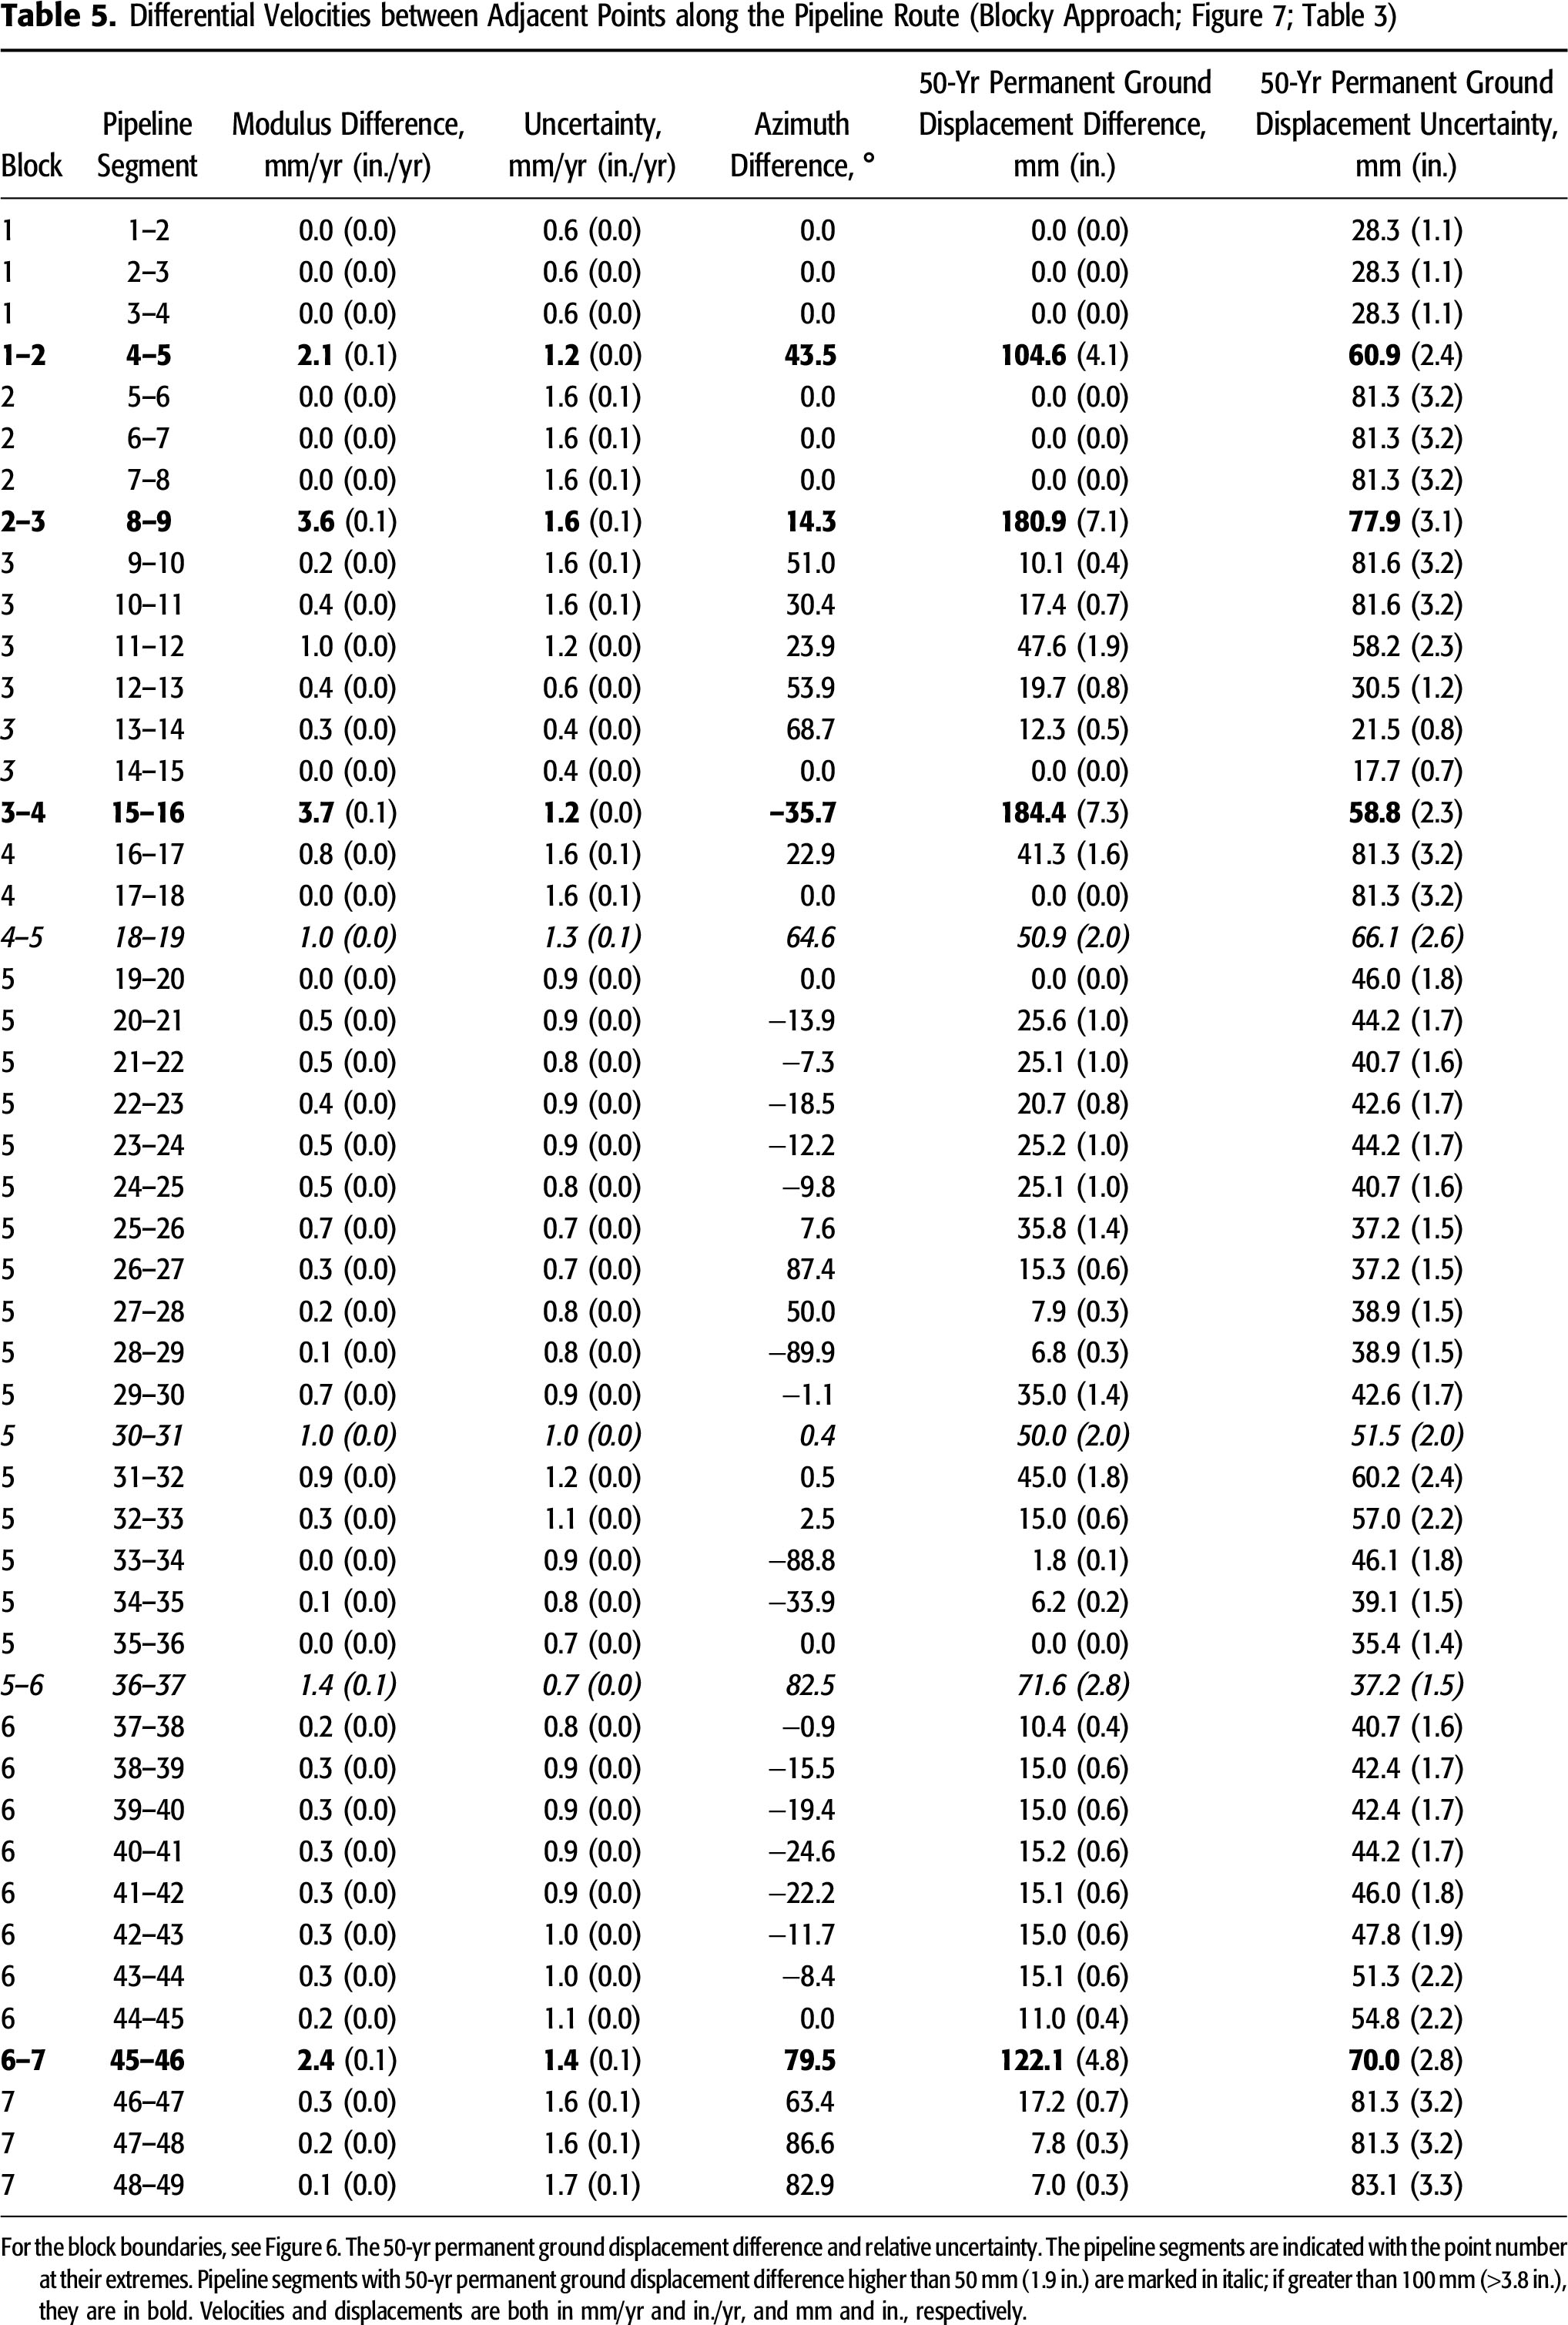
The differential displacement calculated with the blocky approach along the pipeline expected after 50 yr systematically exceeds the minimum value of 50 mm (1.9 in.) at all sections between blocks, but also within block 5 (points 30–31, as for the continuum approach). In particular, at four block boundaries (block 1–2, 2–3, 3–4, and 6–7 boundaries), the differential displacement exceeds the threshold 100 mm (3.9 in.) in 50 yr. Between the points 8–9 and 15–16 (block 2–3 and 3–4 boundaries, respectively), the long-term cumulative value is 181 (7.1 in.) and 184 mm (7.2 in.) (Table 5). From a tectonic point of view, these two maxima occur at both boundaries of block 3 that separate two distinct geodynamic realms: on the west, the accretionary wedge still characterized by a compressional regime and affected by several reverse faults; on the east, a region affected by crustal extension possibly induced by the local postorogenic collapse diachronically migrating westward (Caputo and Pavlides, 1993). Moreover, the calculated values of horizontal contractional (block 1–2 and 2–3 boundaries) and extensional (block 3–4 boundary) rates are in agreement with those estimated for the primary faults affecting the area (Hoffmann et al., 2010; Guzman et al., 2011).
As for the section between points 4–5 (blocks 1–2 boundary), the estimated cumulative displacement of 105 mm (4.1 in.) is related to the most external fault (basal detachment), separating the Albanian accretionary wedge from the Apulian foredeep (ALCS201; Figure 2). On the other side of the investigated area, between the points 45 and 46 (block 6–7 boundary), the 122 mm (4.8 in.) displacement is associated to the change in tectonic regime affecting the region between Thrace, which belongs to the broader extensional Aegean Region, and the lithospheric shear zone depicted by the North Anatolian fault zone–North Aegean trough. The orientation of the differential vector (Table 5) is indeed parallel to the latter zone, and the calculated modulus represents only a fraction of its present-day slip rate (among others, R. E. Reilinger et al., 1997; Kahle et al., 1998; McClusky et al., 2000; Kozaci et al., 2007; Gasperini et al., 2011). The uncertainty in the block boundaries can be estimated to be in the order of 10–20 km (6.2–12.4 mi), comparable to the distance between two subsequent measurement points. With the increasing number of observations, the spacing between the interpolated points can be reduced, allowing a more precise location of the maximum expected differential displacement.
CONCLUDING REMARKS
Starting from systematically revised and homogenized GPS measurements (Pérouse et al., 2012 and reference therein), we calculated the velocities (modulus and azimuth) as well as the relative uncertainties at numerous closely spaced points along the SGC–TAP route, from Apulia to the border between Greece and Turkey, following two different approaches. The first one considers the whole path as a continuum medium; the second approach assumes the presence of crustal blocks characterized by relatively homogeneous velocities, whose boundaries are caused and defined by the activity of the primary seismogenic sources and where the tectonic regime laterally changes across the area (GreDaSS; Caputo et al., 2012; Caputo and Pavlides, 2013).
The kinematic analyses of the points along the pipeline provide valuable information relative to the regions where differential movements and localized deformation could occur in the future, therefore damaging the infrastructure.
In the reference frame here adopted (Pérouse et al., 2012), our results show that the smallest velocity vectors are in central Albania, near Berat, close to the boundary between the blocks 2 and 3, whereas the highest values are recorded in the central part of the SGC–TAP route, in Greece within the block 5, close to Thessaloniki. These velocities imply that the maximum cumulative displacement forecasted in the 50-yr pipeline lifespan for the ending part of the SGC–TAP is 355 mm (14 in.) south of the South Almopia fault (GRCS068), calculated according to both approaches, with an uncertainty of 55 mm (0.4 in.).
However, for the structural integrity of the pipeline, it is of greater and utmost importance to recognize the sectors of this strategic infrastructure that could be affected in the long term by differential displacements, like shear deformation and bending. Indeed, these phenomena could induce tension or compression to cumulate between the pipeline’s adjacent segments, and this could lead to some damage to the infrastructure. For this purpose, we again considered a 50-yr time window.
The blocky approach to the data interpolation here proposed allows emphasizing the differential motion between neighboring blocks and, hence, between the various segments of the pipeline. Although the expected long-term differential movements are in the order of some centimeters (up to ∼18 cm [∼7.1 in.]), local stresses could rise if deformation will be concentrated along the pipeline. In such a case, even displacement as small as 50 mm (1.9 in.) can activate the breakage. To know whether the expected permanent ground displacement can overpass the indicative threshold of 100 mm (3.9 in.) in 50 yr can allow for taking the necessary counteractions at the right time. We recognized four sectors where the long-term relative movement between neighboring points could be as high as 181 ± 78 mm (7.1 ± 3 in.) and 184 ± 59 mm (7.2 ± 2.3 in.), near Berat (Albania) and in Greece, close to the border with Turkey, respectively (Figure 7; Table 5).
REFERENCES CITED
Altamimi, Z., L. Métivier, and X. Collilieux, 2012, ITRF2008 plate motion model: Journal of Geophysical Research, v. 117, no. B7, B07402, 14 p., doi:10.1029/2011JB008930.
Altıner, Y., Ž. Bačić, T. Bašić, A. Coticchia, M. Medved, M. Mulić, and B. Nurçe, 2006, Present-day tectonics in and around the Adria plate inferred from GPS measurements in Y. Dilek and S. Pavlides, eds., Postcollisional tectonics and magmatism in the Mediterranean region and Asia: Geological Society of America Special Papers 409, p. 43–55, doi:10.1130/2006.2409(03).
Ambraseys, N. N., and J. A. Jackson, 1998, Faulting associated with historical and recent earthquakes in the Eastern Mediterranean region: Geophysical Journal International, v. 133, no. 2, p. 390–406, doi:10.1046/j.1365-246X.1998.00508.x.
Armijo, R., B. Meyer, G. C. P. King, A. Rigo, and D. Papanastassiou, 1996, Quaternary evolution of the Corinth Rift and its implications for the Late Cenozoic evolution of the Aegean: Geophysical Journal International, v. 126, no. 1, p. 11–53, doi:10.1111/j.1365-246X.1996.tb05264.x.
Ballantyne, D., 2008, The ShakeOut scenario supplemental study: Oil and gas pipelines, accessed September 5, 2019, http://books.google.it/books?id=7PU1A6N3ZOAC.
Biju-Duval, B., J. Dercourt, and X. Le Pichon, 1977, From the Tethys Ocean to the Mediterranean Seas: A plate tectonic model of the evolution of the western Alpine system, in B. Biju-Duval and L. Montadert, eds., Structural history of the Mediterranean basins: Paris, Editions Technip, p. 143–164.
Caporali, A., C. Aichhorn, M. Barlik, M. Becker, I. Fejes, L. Gerhatova, and D. Ghitau, et al., 2009, Surface kinematics in the Alpine-Carpathian-Dinaric and Balkan region inferred from a new multi-network GPS combination solution: Tectonophysics, v. 474, no. 1–2, p. 295–321, doi:10.1016/j.tecto.2009.04.035.
Caporali, A., C. Braitenberg, P. Montone, G. Rossi, G. Valensise, A. Viganò, and J. Zurutuza, 2018, A quantitative approach to the loading rate of seismogenic sources in Italy: Geophysical Journal International, v. 213, no. 3, p. 2096–2111, doi:10.1093/gji/ggy112.
Caputo, R., 2005, Ground effects of large morphogenic earthquakes: Journal of Geodynamics, v. 40, no. 2–3, p. 113–118, doi:10.1016/j.jog.2005.07.001.
Caputo, R., A. Chatzipetros, S. Pavlides, and S. Sboras, 2012, The Greek Database of Seismogenic Sources (GreDaSS): State-of-the-art for northern Greece: Annals of Geophysics, v. 55, no. 5, p. 859–894, doi:10.4401/ag-5168.
Caputo, R., M. Mucciarelli, and S. Pavlides, 2008, Magnitude distribution of linear morphogenic earthquakes in the Mediterranean region: Insights from palaeoseismological and historical data: Geophysical Journal International, v. 174, no. 3, p. 930–940, doi:10.1111/j.1365-246X.2008.03834.x.
Caputo, R., and S. Pavlides, 1993, Late Cainozoic geodynamic evolution of Thessaly and surroundings (central-northern Greece): Tectonophysics, v. 223, no. 3–4, p. 339–362, doi:10.1016/0040-1951(93)90144-9.
Caputo, R., and S. Pavlides, 2013, The Greek Database of Seismogenic Sources (GreDaSS), version 2.0.0: A compilation of potential seismogenic sources (Mw > 5.5) in the Aegean Region, accessed September 4, 2019, http://gredass.unife.it/.
Cenni, N., E. Mantovani, P. Baldi, and M. Viti, 2012, Present kinematics of Central and Northern Italy from continuous GPS measurements: Journal of Geodynamics, v. 58, p. 62–72, doi:10.1016/j.jog.2012.02.004.
Chatzipetros, A., and S. Pavlides, 2004, Geometry and kinematics of the Maronia-Makri active fault (Thrace, northeastern Greece): 4th National Geophysical Conference of the Bulgarian Geophysical Society, Sofia, Bulgaria, October 4–5, 2004, p. 61–63.
Copley, A., F. Boait, J. Hollingsworth, J. Jackson, and D. McKenzie, 2009, Subparallel thrust and normal faulting in Albania and the roles of gravitational potential energy and rheology contrasts in mountain belts: Journal of Geophysical Research. Solid Earth, v. 114, no B5, 12 p., doi:10.1029/2008JB005931.
D’Agostino, N., A. Avallone, D. Cheloni, E. D’Anastasio, S. Mantenuto, and G. Selvaggi, 2008, Active tectonics of the Adriatic region from GPS and earthquake slip vectors: Journal of Geophysical Research, v. 113, no. B12, B12413, 19 p., doi:10.1029/2008JB005860.
D’Agostino, N., E. D’Anastasio, A. Gervasi, I. Guerra, M. R. Nedimović, L. Seeber, and M. Steckler, 2011, Forearc extension and slow rollback of the Calabrian Arc from GPS measurements: Geophysical Research Letters, v. 38, no. 17, L17304, 6 p., doi:10.1029/2011GL048270.
de Berg, M., O. Cheong, M. van Kreveld, and M. Overmars, 2008, Computational geometry: Algorithms and applications: Heidelberg, Germany, Springer-Verlag, 386 p., doi:10.1007/978-3-540-77974-2.
Devoti, R., N. D’Agostino, E. Serpelloni, G. Pietrantonio, F. Riguzzi, A. Avallone, and A. Cavaliere, et al., 2017, A combined velocity field of the Mediterranean region: Annals of Geophysics, v. 60, no. 2, S0215, 19 p., doi:10.4401/ag-7059.
Devoti, R., A. Esposito, G. Pietrantonio, A. R. Pisani, and F. Riguzzi, 2011, Evidence of large scale deformation patterns from GPS data in the Italian subduction boundary: Earth and Planetary Science Letters, v. 311, no. 3–4, p. 230–241, doi:10.1016/j.epsl.2011.09.034.
Doutsos, T., and I. Koukouvelas, 1998, Fractal analysis of normal faults in northwestern Aegean area, Greece: Journal of Geodynamics, v. 26, no. 2–4, p. 197–216, doi:10.1016/S0264-3707(97)00052-5.
Doutsos, T., I. K. Koukouvelas, and P. Xypolias, 2006, A new orogenic model for the External Hellenides, in A. H. F. Robertson and D. Mountrakis, eds., Tectonic development of the Eastern Mediterranean region: Geological Society, London, Special Publications 2006, v. 260, p. 507–520, doi:10.1144/GSL.SP.2006.260.01.21.
Floyd, M. A., H. Billiris, D. Paradssis, G. Veis, A. Avallone, P. Briole, and and S. McClusky, et al., 2010, A new velocity field for Greece: Implications for the kinematics and dynamics of the Aegean: Journal of Geophysical Research, v. 115, no. B10, B10403, 25 p., doi:10.1029/2009JB007040.
Ganas, A., A. I. Oikonomou, and C. Tsimi, 2013, NOAfaults: A digital database for active faults in Greece: Deltio tis Ellinikis Geologikis Etaireias, v. 47, no. 2, p. 518–530, doi:10.12681/bgsg.11079.
Gasperini, L., A. Polonia, M. N. Çağatay, G. Bortoluzzi, and V. Ferrante, 2011, Geological slip rates along the North Anatolian Fault in the Marmara region: Tectonics, v. 30, no. 6, TC6001, 14 p., doi:10.1029/2011TC002906.
Goldsworthy, M., and J. Jackson, 2000, Active normal fault evolution in Greece revealed by geomorphology and drainage patterns: Journal of the Geological Society, v. 157, no. 5, p. 967–981, doi:10.1144/jgs.157.5.967.
Goldsworthy, M., J. Jackson, and J. Haines, 2002, The continuity of active fault systems in Greece: Geophysical Journal International, v. 148, no. 3, p. 596–618, doi:10.1046/j.1365-246X.2002.01609.x.
Guzman, O., J.-L. Mugnier, R. Koçi, R. Vassallo, J. Carcaillet, F. Jouanne, and E. Fouache, 2011, Active tectonics of Albania inferred from fluvial terraces geometries: 2nd International Union for Quaternary Research-International Geoscience Programme-567 International Workshop on Active Tectonics: Earthquake Geology, Archaeology and Engineering, Corinth, Greece, September 19–24, 2011, p. 66–69.
Haeussler, P. J., D. P. Schwartz, T. E. Dawson, H. D. Stenner, J. J. Lienkaemper, B. Sherrod, F. R. Cinti, P. Montone, P. A. Craw, A. J. Crone, and S. F. Personius, 2004, Surface rupture and slip distribution of the Denali and Totschunda faults in the November 3, 2002, M7.9 earthquake, Alaska: Bulletin of the Seismological Society of America, v. 94, no. 6B, p. S23–S52, doi:10.1785/0120040626.
Hatzfeld, D., A. A. Christodoulou, E. M. Scordilis, D. Panagiotopoulos, and P. M. Hatzidimitriou, 1987, A microearthquake study of the Mygdonian graben (northern Greece): Earth and Planetary Science Letters, v. 81, no. 4, p. 379–396, doi:10.1016/0012-821X(87)90125-7.
Hoffmann, N., K. Reicherter, T. Fernàndez-Steeger, and C. Grützner, 2010, Evolution of ancient Lake Ohrid: A tectonic perspective: Biogeosciences, v. 7, no. 10, p. 3377–3386, doi:10.5194/bg-7-3377-2010.
Hollenstein, C., M. D. Müller, A. Geiger, and H.-G. Kahle, 2008, Crustal motion and deformation in Greece from a decade of GPS measurements, 1993–2003: Tectonophysics, v. 449, no. 1–4, p. 17–40, doi:10.1016/j.tecto.2007.12.006.
V., Jacobshagen, (ed.), 1986, Geologie von Griechenland: Berlin and Stuttgart, Borntraeger, 363p.
Jouanne, F., J. L. Mugnier, R. Koci, S. Bushati, K. Matev, N. Kuka, I. Shinko, S. Kociu, and L. Duni, 2012, GPS constraints on current tectonics of Albania: Tectonophysics, v. 554–557, p. 50–62, doi:10.1016/j.tecto.2012.06.008.
Kahle, H.-G., C. Straub, R. Reilinger, S. McClusky, R. King, K. Hurst, G. Veis, K. Kastens, and P. Cross, 1998, The strain field in the Eastern Mediterranean region, estimated by repeated GPS measurements: Tectonophysics, v. 294, no. 3–4, p. 237–252, doi:10.1016/S0040-1951(98)00102-4.
Khatri Chhetri, H., and I. Zafar, 2013, Automatic detection and classification of pavement damages based on laser scanning data, Master’s thesis, Luleå University of Technology, Luleå, Sweden, 140 p., accessed February 27, 2020, http://www.diva-portal.org/smash/get/diva2:1017374/FULLTEXT02.
Kiratzi, A., 2011, The 6 September 2009 Mw5.4 earthquake in Eastern Albania–FYROM border: Focal mechanisms, slip model, ShakeMap: Turkish Journal of Earth Sciences, v. 20, no. 4, p. 475–488, doi:10.3906/yer-1001-7.
Kiratzi, A., C. Benetatos, and Z. Roumelioti, 2005, Special features of the seismotectonics of NE Aegean Sea and the surrounding lands [in Greek]: Deltio tis Ellinikis Geologikis Etaireias, v. 37, p. 9–18.
Kotzev, V., R. Nakov, T. Georgiev, B. C. Burchfiel, and R. W. King, 2006, Crustal motion and strain accumulation in western Bulgaria: Tectonophysics, v. 413, no. 3–4, p. 127–145, doi:10.1016/j.tecto.2005.10.040.
Koukouvelas, I. K., and A. Aydin, 2002, Fault structure and related basins of the North Aegean Sea and its surroundings: Tectonics, v. 21, no. 5, 19 p., doi:10.1029/2001TC901037.
Kozaci, Ö., J. Dolan, R. Finkel, and R. Hartleb, 2007, Late Holocene slip rate for the North Anatolian fault, Turkey, from cosmogenic 36Cl geochronology: Implications for the constancy of fault loading and strain release rates: Geology, v. 35, no. 10, p. 867–870, doi:10.1130/G23187A.1.
Le Pichon, X., and J. Angelier, 1979, The Hellenic arc and trench system: A key to the neotectonic evolution of the Eastern Mediterranean area: Tectonophysics, v. 60, no. 1–2, p. 1–42, doi:10.1016/0040-1951(79)90131-8.
Lisowski, M., W. H. Prescott, J. C. Savage, and M. J. Johnston, 1990, Geodetic estimate of coseismic slip during the 1989 Loma Prieta, California, earthquake: Geophysical Research Letters, v. 17, no. 9, p. 1437–1440, doi:10.1029/GL017i009p01437.
Louvari, E., A. Kiratzi, B. Papazachos, and P. Hatzidimitriou, 2001, Fault-plane solutions determined by waveform modeling confirm tectonic collision in the Eastern Adriatic: Pure and Applied Geophysics, v. 158, p. 1613–1637, doi:10.1007/PL00001236.
Maggini, M., and R. Caputo, 2020, Rheological behaviour in collisional and subducting settings: Inferences for the seismotectonics of the Hellenic Region: Turkish Journal of Earth Sciences, v. 29, p. 381–405, doi:10.3906/yer-1909-4.
Mantovani, E., M. Viti, N. Cenni, D. Albarello, and D. Babbucci, 2001, Short and long term deformation patterns in the Aegean-Anatolian systems: Insights from space geodetic data (GPS): Geophysical Research Letters, v. 28, no. 12, p. 2325–2328, doi:10.1029/2000GL012634.
Matev, K., 2011, GPS constraints on current tectonics of Southwest Bulgaria, Northern Greece, and Albania: Ph.D. thesis, Terre, Univers, Environnement, Université de Savoie and Bulgarian Academy of Sciences, Chambery, France, 203 p.
McClusky, S., S. Balassanian, A. Barka, C. Demir, S. Ergintav, I. Georgiev, and O. Gurkan, et al., 2000, Global positioning system constraints on plate kinematics and dynamics in the Eastern Mediterranean and Caucasus: Journal of Geophysical Research, v. 105, no. B3, p. 5695–5719, doi:10.1029/1999JB900351.
McKenzie, D., 1972, Active tectonics of the Mediterranean region: Geophysical Journal of the Royal Astronomical Society, v. 30, no. 2, p. 109–185, doi:10.1111/j.1365-246X.1972.tb02351.x.
Mercier, J. L., 1976, La neotectonique. Ses methodes et ses buts. Un exemple: I’Arc Egéen (Méditerranée orientale) [in French]: Revue de Géographie Physique et de Géologie Dynamique, v. 18, no. 4, p. 323–346.
Mercier, J. L., N. Delibasis, A. Gauthier, J. J. Jarrige, F. Lemeille, H. Philip, M. Sebrier, and D. Sorel, 1979a, La néotectonique de l’Arc Egéen [in French]: Revue de Géologie Dynamique et de Géographie Physique, v. 21, p. 67–92.
Mercier, J. L., N. Mouyaris, C. Simeakis, T. Roundoyannis, and C. Angelidhis, 1979b, Intraplate deformation: A quantitative study of the faults activated by the 1978 Thessaloniki earthquakes: Nature, v. 278, no. 5699, p. 45–48, doi:10.1038/278045a0.
Mercier, J. L., D. Sorel, P. Vergely, and K. Simeakis, 1989, Extensional tectonic regimes in the Aegean basins during the Cenozoic: Basin Research, v. 2, no. 1, p. 49–71, doi:10.1111/j.1365-2117.1989.tb00026.x.
Mountrakis, D., 2006, Tertiary and quaternary tectonics of Greece, in Y. Dilek and S. Pavlides, eds., Postcollisional tectonics and magmatism in the Mediterranean region and Asia: Geological Society of America Special Papers 409, p. 125–136 doi:10.1130/2006.2409(07).
Mountrakis, D., A. Kilias, S. Pavlides, L. Sotiriadis, A. Psilovikos, Th. Astaras, and E. Vavliakis, et al., 1996a, Neotectonic map of Greece, Langadhas sheet: Earthquake Planning and Protection Organisation and European Centre on Prevention and Forecasting of Earthquakes, Athens, scale 1:100,000, 1 sheet.
Mountrakis, D., A. Kilias, S. Pavlides, L. Sotiriadis, A. Psilovikos, Th. Astaras, and E. Vavliakis, et al., 1996b, Neotectonic map of Greece, Thessaloniki sheet: Earthquake Planning and Protection Organisation and European Centre on Prevention and Forecasting of Earthquakes, Athens, scale 1:100,000, 1 sheet.
Mountrakis, D., and M. D. Tranos, 2004, The Kavala-Xanthi-Komotini fault (KXKF): A complicated active fault zone in Eastern Macedonia-Thrace (Northern Greece): 5th International Symposium on Eastern Mediterranean Geology, Thessaloniki, Greece, April 13–20, 2004, p. 857–860.
Mountrakis, D., M. Tranos, C. Papazachos, E. Thomaidou, E. Karagianni, and D. Vamvakaris, 2006, Neotectonic and seismological data concerning major active faults, and the stress regimes of Northern Greece: Geological Society, London, Special Publications 2006, v. 260, p. 649–670, doi:10.1144/GSL.SP.2006.260.01.28.
Muço, B., 1994, Focal mechanism solutions for Albanian earthquakes for the years 1964–1988: Tectonophysics, v. 231, no. 4, p. 311–323, doi:10.1016/0040-1951(94)90041-8.
O’Rourke, M. J., and X. Liu, 1999, Response of buried pipelines subject to earthquake effects: Monograph Series, Multidisciplinary Center for Earthquake Engineering Research, MCEER-99-MN03, 249 p.
O’Rourke, M. J., and X. Liu, 2012, Seismic design of buried and offshore pipelines: Buffalo, New York, Multidisciplinary Center for Earthquake Engineering Research Monograph Series, MCEER-12-MN04, 276 p.
Papanikolaou, D., 2013, Tectonostratigraphic models of the Alpine terranes and subduction history of the Hellenides: Tectonophysics, v. 595–596, p. 1–24, doi:10.1016/j.tecto.2012.08.008.
Papazachos, B. C., 1988, Active tectonics in the Aegean and surrounding area, in J. Bonnin, M. Cara, A. Cisternas, and R. Fantechi, eds., Seismic hazard in Mediterranean regions: Dordrecht, the Netherlands, Kluwer Academic Publisher, p. 301–331.
Papazachos, B. C., and C. B. Papazachou, 1997, The earthquakes of Greece: Thessaloniki, Greece, Greece Ziti Publ., 304 p.
Pavlides, S., and R. Caputo, 2004, Magnitude versus faults’ surface parameters: Quantitative relationships from the Aegean: Tectonophysics, v. 380, no. 3–4, p. 159–188, doi:10.1016/j.tecto.2003.09.019.
Pavlides, S. B., and D. M. Mountrakis, 1987, Extensional tectonics of northwestern Macedonia, Greece, since the late Miocene: Journal of Structural Geology, v. 9, no. 4, p. 385–392, doi:10.1016/0191-8141(87)90115-5.
Pérouse, E., N. Chamot-Rooke, A. Rabaute, P. Briole, F. Jouanne, I. Georgiev, and D. Dimitrov, 2012, Bridging onshore and offshore present-day kinematics of central and eastern Mediterranean: Implications for crustal dynamics and mantle flow: Geochemistry Geophysics Geosystems, v. 13, no. 9, Q09013, 25 p., doi:10.1029/2012GC004289.
Porter, K. A., C. Scawthorn, D. G. Honegger, T. D. O’Rourke, and F. Blackburn, 1991, Performance of water supply pipelines in liquefied soil, in Eguchi, R. T., ed., Proceedings of the Fourth U.S.–Japan Workshop on Earthquake Disaster Prevention for Lifeline Systems: Washington, DC, National Institute of Standards and Technology Special Publication 840, p. 3–17.
Pour-Ghaz, M., J. Wilson, R. Spragg, S. S. Nadukuru, J. Kim, S. M. O’Connor, and E. M. Byrne, et al., 2018, Performance and damage evolution of plain and fibre-reinforced segmental concrete pipelines subjected to transverse permanent ground displacement: Structure and Infrastructure Engineering, v. 14, no. 2, p. 232–246, doi:10.1080/15732479.2017.1349809.
Reilinger, R., S. McClusky, P. Vernant, S. Lawrence, S. Ergintav, R. Cakmak, and H. Ozener, et al., 2006, GPS constraints on continental deformation in the Africa-Arabia-Eurasia continental collision zone and implications for the dynamics of plate interactions: Journal of Geophysical Research, v. 111, no. B5, B05411, 26 p., doi:10.1029/2005JB004051.
Reilinger, R. E., S. C. McClusky, M. B. Oral, R. W. King, M. N. Toksoz, A. A. Barka, I. Kinik, O. Lenk, and I. Sanli, 1997, Global positioning system measurements of present-day crustal movements in the Arabia-Africa-Eurasia plate collision zone: Journal of Geophysical Research, v. 102, no. B5, p. 9983–9999, doi:10.1029/96JB03736.
Robertson, A.-H. F., P. D. Clift, P. J. Degnan, and G. Jones, 1991, Palaeogeographic and palaeotectonic evolution of the Eastern Mediterranean Neotethys: Palaeogeography, Palaeoclimatology, Palaeoecology, v. 87, no. 1–4, p. 289–343, doi:10.1016/0031-0182(91)90140-M.
Royden, L. H., and D. J. Papanikolaou, 2011, Slab segmentation and late Cenozoic disruption of the Hellenic arc: Geochemistry, Geophysics, Geosystems, v. 12, no. 3, Q03010, 24 p., doi:10.1029/2010GC003280.
Şengör, A. M. C., 1985, The story of Tethys: How many wives did Okeanos have?: Episodes, v. 8, p. 3–12.
Serpetsidaki, A., G.-A. Tselentis, N. Martakis, and E. Sokos, 2012, Seismicity and seismotectonics study in Southwestern Albania using a local dense seismic network: Bulletin of the Seismological Society of America, v. 102, no. 5, p. 2090–2097, doi:10.1785/0120110139.
Tranos, M. D., E. E. Papadimitriou, and A. A. Kilias, 2003, Thessaloniki-Gerakarou Fault Zone (TGFZ): The western extension of the 1978 Thessaloniki earthquake fault (Northern Greece) and seismic hazard assessment: Journal of Structural Geology, v. 25, no. 12, p. 2109–2123, doi:10.1016/S0191-8141(03)00071-3.
Weisstein, E. W., 2010, Delaunay triangulation: MathWorld–A Wolfram web resource, accessed September 5, 2019, http://mathworld.wolfram.com/DelaunayTriangulation.html.
Wells, D. L., and K. J. Coppersmith, 1994, New empirical relationships among magnitude, rupture length, rupture width, rupture area, and surface displacement: Bulletin of the Seismological Society of America, v. 84, no. 4, p. 974–1002.
Wortel, M. J. R., S. D. B. Goes, and W. Spakman, 1990, Structure and seismicity of the Aegean subduction zone: Terra Nova, v. 2, no. 6, p. 554–562, doi:10.1111/j.1365-3121.1990.tb00120.x.
Wright, T., B. Parsons, and E. Fielding, 2001, Measurement of interseismic strain accumulation across the North Anatolian Fault by satellite radar interferometry: Geophysical Research Letters, v. 28, no. 10, p. 2117–2120, doi:10.1029/2000GL012850.
AUTHORS
Giuliana Rossi is a geophysicist and senior researcher at OGS and vice director of the division Centro di Ricerche Sismologiche, a member (2012–2020) and coordinator (2014–2020) of the scientific committee, and an OGS member representative for the Observatories and Research Facilities for European Seismology (2019 to present). She has 30 years of experience in geophysics and geodesy, both theoretical and applied.
Riccardo Caputo is a full professor of earthquake geology and structural geology, project leader of the Greek Database of Seismogenic Sources, and has worked for three decades on the tectonics, geodynamics, and active faults of the broader Aegean Region. He is a member of the Commissione Grandi Rischi at the Italian Prime Minister Presidency.
David Zuliani is a technologist at OGS and an expert in global navigation satellite system (GNSS) for crustal deformation monitoring and real-time kinematic (RTK) services. He has a master’s degree in management of research, innovation, and technology from Politecnico di Milano (Italy). He is an OGS member representative for the European Plate Observing System Implementation Phase project and University Navigation Satellite Timing And Ranging Global Positioning System Consortium. He is responsible for the maintenance and implementation of the OGS Friuli Deformation GNSS permanent network.
Paolo Fabris is a technician at OGS and an expert in GNSS processing with the Massachusetts Institute of Technology software suite GNSS At MIT/Global Kalman filter for crustal deformation studies and monitoring. He has a good knowledge of different GNSS softwares (Topcon Tools, RTK Library) for both real-time and postprocessing applications. He is a specialist in GNSS campaigns and proficient in GNSS permanent site installation and maintenance.
Massimiliano Maggini has received a Ph.D. in tectonics from the University of Ferrara, Italy. He received his B.Sc. degree in geology as well as his M.S. degree in geoenvironmental resources and risks at the University of Camerino (Italy). His research interests and expertise are in the seismotectonic and rheological characterizations of the broader Aegean Region.
Panagiotis Karvelis is a geophysicist and has an M.Sc. degree in geology from the University of Trieste (Italy) and a Ph.D. in applied geophysics from the University of Athens (Greece). He has 25 years of experience in the energy sector. He participates as a project manager in several oil- and gas-pipeline projects (IGI Poseidon, Trans Adriatic Pipeline [TAP], Baku-Ceyhan, etc.). Since 2014, he has been the owner of the Korros-E consulting company, in the energy sector.
ACKNOWLEDGMENTS
This work was done within the project TAP seismological investigation for the company Energy and Innovation SE New Build & Technology GmbH. We thank Dario Slejko and the other project partners for valuable information, data, advice, and fruitful discussions. We are grateful to Maurizio Battaglia, Nicola Cenni, and Ioannis Koukouvelas for critically reading the paper and providing constructive comments. For our geographic information system (GIS)–based strain velocity system, we used Quantum GIS, a user-friendly open-source GIS licensed under the GNU’s Not Unix general public license (https://hub.qgis.org/). For the interpolation, we used the function TriScatteredInterp from the MATLAB® library (MATLAB R2011a).