The AAPG/Datapages Combined Publications Database
Environmental Geosciences (DEG)
Figure
Environmental Geosciences (DEG); Year: 2020; Issue: September DOI: 10.1306/eg.01222019023
Return to Full Text
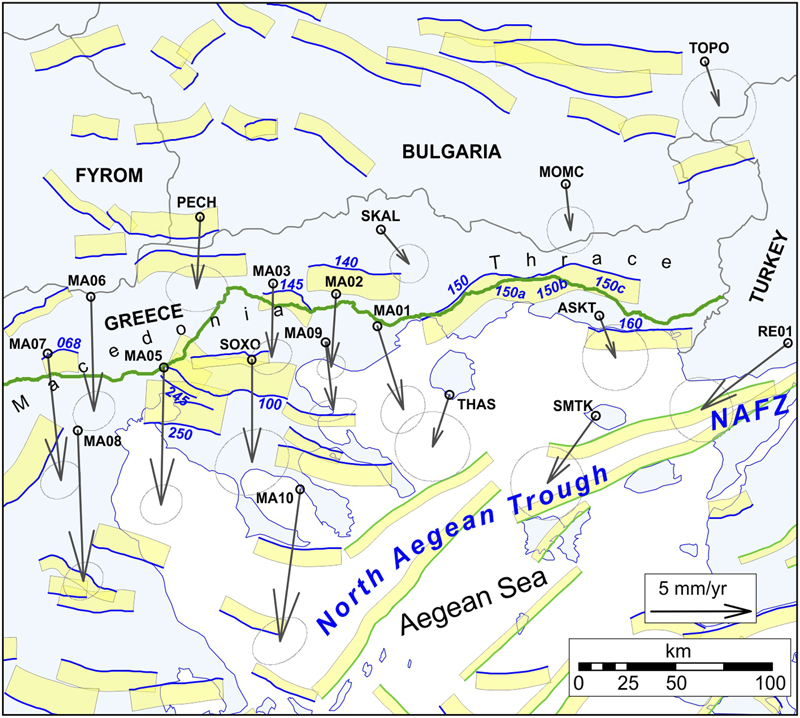
Figure 3. Zoom on the eastern part of the route showing the global positioning system velocities (black arrows) and relative errors (ellipses). Location map in Figure 1. The yellow polygons represent the horizontal projection of the seismogenic sources provided in Greek Database of Seismogenic Sources (Caputo and Pavlides, 2013), where the thick border indicates their upper tip projection (red, green, and blue correspond to a prevailing reverse, strike-slip, and normal kinematics, respectively). For the sake of graphical simplicity, the seismogenic sources cited in the text are labeled with only the numerical part, whereas the country code (AL and GR) and the source code (CS for composite source or IS for individual source) are omitted. Black labels are global navigation satellite system station names. FYROM = former Yugoslav Republic of Macedonia; MA = from Matev (2011); NAFZ = North Anatolian fault zone; RE = from Reilinger et al. (2006).
Figure 3. Zoom on the eastern part of the route showing the global positioning system velocities (black arrows) and relative errors (ellipses). Location map in Figure 1. The yellow polygons represent the horizontal projection of the seismogenic sources provided in Greek Database of Seismogenic Sources (Caputo and Pavlides, 2013), where the thick border indicates their upper tip projection (red, green, and blue correspond to a prevailing reverse, strike-slip, and normal kinematics, respectively). For the sake of graphical simplicity, the seismogenic sources cited in the text are labeled with only the numerical part, whereas the country code (AL and GR) and the source code (CS for composite source or IS for individual source) are omitted. Black labels are global navigation satellite system station names. FYROM = former Yugoslav Republic of Macedonia; MA = from Matev (2011); NAFZ = North Anatolian fault zone; RE = from Reilinger et al. (2006).