About This Item
- Full TextFull Text(subscription required)
- Pay-Per-View PurchasePay-Per-View
Purchase Options Explain
Share This Item
The AAPG/Datapages Combined Publications Database
Ohio Geological Society
Abstract
OGS-AAPG
Ohio Geological Society:Canton Symposium IV: Fourth Annual Technical Symposium, October 9,
A NEW MAP SERIES FOR OIL AND GAS POOLS/FIELDS OF OHIO
Lawrence H. Wickstrom, Ohio Department of Natural Resources, Division of Geological Survey, Columbus, OH
Ronald A. Riley, Ohio Department of Natural Resources, Division of Geological Survey, Columbus, OH
ABSTRACT
The last update for the Ohio oil and gas fields map was issued in 1974. Since then, considerable drilling and new production has occurred in Ohio, especially in the eastern half of the state. The updating of this map has been a high priority for many years at ODNR, but the size of the task was so large that it was not undertaken until the U.S. Department of Energy (USDOE) contracted the ODNR Divisions of Geological Survey and Oil and Gas (working with the Appalachian Oil and Natural Gas Research Consortium) to update a large portion of the oil and gas fields map as part of the Appalachian Basin Gas Atlas project and the Tertiary Oil Recovery Information System (TORIS) project. The Gas Atlas project documented the 30 major gas plays within the basin, whereas the TORIS project developed a computerized inventory of major oil producing reservoirs in each state. These two projects were completed over a three year period, involved more than 15 staff members from the two Divisions, and more than 25 college interns.
In eastern Ohio, where over 30 producing intervals may overlie one another, it is especially difficult to distinguish individual productive trends when viewing all production together. However, the large workforce available to the USDOE projects allowed the Divisions to compile the data and maps in an optimal fashion; mapping individual areas of gas storage and oil and gas production by producing horizon or group. Individual horizon production maps have been compiled into separate geologic groupings and placed on a statewide basemap showing county and township boundaries; these are now available as 1:500,000 scale (approximately 1"=8 miles) color plots in the Division of Geological Survey's Digital Chart and Map Series (DCMS). All of the individual maps also have been compiled into one composite oil and gas fields map for the state which also is available. Following is a list of DCMS products which comprise the new Oil and Gas Pools/Fields of Ohio series.
| Pub. No. | Map showing production from: |
|---|---|
| DCMS 13 | Lower and Middle Pennsylvanian sandstones undifferentiated |
| DCMS 14 | Lower and Upper Mississippian sandstones undifferentiated |
| DCMS 15 | Lower Mississippian Berea Sandstone and Cussewago Sandstone |
| DCMS 16 | Upper Devonian fractured black shales and gray and black shales |
| DCMS 17 | Upper Devonian siltstones and "Big Lime" interval |
| DCMS 18 | Lower Silurian Cataract/Medina Group |
| DCMS 19 | Middle Ordovician Trenton Limestone and Black River Group |
| DCMS 20 | Middle Ordovician and Upper Cambrian Knox Dolomite |
| DCMS 21 | Generalized map showing all oil, gas, and storage pools/fields |
The maps in this series can be used as reconnaissance tools for exploration, secondary recovery, environmental assessments, and planning issues. Having the production mapped separately in these groups permits greater flexibility to the explorationist in what he/she may want to view. If, for instance, one wants to view only pre-"Clinton" production, this is now possible. One could also look at production from units deposited during, before, or since certain tectonic events. Many other examples could be listed.
The DCMS maps are computer generated and, therefore, allow for easy updating, correction, etc. Customization of scale and content also is now possible with this series. Additional base map information (interstate highways, railroads, etc.) will be offered soon. The Division intends to link this map series with the developing digital oil and gas spot maps, and the overall oil and gas well database, using Geographic Information Systems (GIS) technology. Once complete, the oil and gas industry will have a dynamic set of tools available to constantly update oil and gas pools, fields, outposts, wildcats, etc.
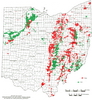 |
OIL AND GAS FIELDS OF OHIO, PRINTED IN 1974 Areas in which oil or gas is being produced or has been produced commercially since 1860. A detailed version of this map, at a scale of 1 inch = about 8 miles, also is available. This more detailed map provides data on discovery date, depth, and producing horizon of individual pools, and stratigraphy. Natural gas and liquid petroleum storage areas in Ohio also are shown. |
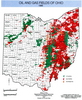 |
OIL AND GAS FIELDS OF OHIO, PRINTED IN 1996 |
Pay-Per-View Purchase Options
The article is available through a document delivery service. Explain these Purchase Options.
| Watermarked PDF Document: $14 | |
| Open PDF Document: $24 |