The AAPG/Datapages Combined Publications Database
Journal of Sedimentary Research (SEPM)
Full Text
![]() Click to view page images in PDF format.
Click to view page images in PDF format.
© 2021, SEPM (Society for Sedimentary Geology) Open Access. This paper is published under the terms of the CC-BY 4.0 license.
DOI: 10.2110/jsr.2020.154
Evolution of calcite microcrystal morphology during experimental dissolution
Abstract
Phanerozoic limestones are composed of low-Mg calcite microcrystals (i.e., micrite) that typically measure between 1 and 9 μm in diameter. These microcrystals, which host most of the microporosity in subsurface reservoirs, are characterized by a variety of microtextures. Despite the overwhelming consensus that calcite microcrystals are diagenetic, the origin of the various textures is widely debated. The most commonly reported texture is characterized by polyhedral and rounded calcite microcrystals, which are interpreted to form via partial dissolution of rhombic microcrystals during burial diagenesis. A proposed implication of this model is that dissolution during burial is responsible for significant porosity generation. This claim has been previously criticized based on mass-balance considerations and geochemical constrains. To explicitly test the dissolution model, a series of laboratory experiments were conducted whereby various types of calcites composed of rhombic and polyhedral microcrystals were partially dissolved under a constant degree of undersaturation, both near and far-from-equilibrium.
Our results indicate that calcite crystals dissolved under far-from-equilibrium conditions develop rounded edges and corners, inter-crystal gulfs (narrow grooves or channels between adjacent crystals), and a few etch pits on crystal faces—observations consistent with the burial-dissolution hypothesis. Crystals dissolved under near-equilibrium conditions, in contrast, retain sharp edges and corners and develop ledges and pits—suggesting that dissolution occurs more selectively at high-energy sites. These observations support the longstanding understanding that far-from-equilibrium dissolution is transport-controlled, and near-equilibrium dissolution is surface-controlled. Our results also show that while the rhombic calcite crystals may develop rounded edges and corners when dissolved under far-from-equilibrium conditions the crystals themselves do not become spherical. By contrast, polyhedral crystals not only develop rounded edges and corners when dissolved under far-from-equilibrium conditions but become nearly spherical with continued dissolution. Collectively, these observations suggest that rounded calcite microcrystals more likely form from a precursor exhibiting an equant polyhedral texture, rather than from a euhedral rhombic precursor as previously proposed. Lastly, the observation that calcite crystals developed rounded edges and corners and inter-crystal gulfs after only 5% dissolution indicates that the presence of such features in natural limestones need not imply that significant porosity generation has occurred.
INTRODUCTION
Phanerozoic limestones globally are characterized by low-Mg calcite (calcite) microcrystals that typically range in diameter between 1 and 9 μm that comprise both carbonate matrix and allochems (Moshier 1989; Kaczmarek et al. 2015). These microcrystals are important because the micropores hosted among them account for most of limestone microporosity (Cantrell and Hagerty 1999; Kaczmarek et al. 2015; Hashim and Kaczmarek 2019). Calcite microcrystals have been classified according to various textural classes based on crystal shape, size, and contact geometry (e.g., Moshier 1989; Deville de Periere et al. 2011; Kaczmarek et al. 2015). Although these classifications differ in their details, they largely agree on how to differentiate between the three major textural classes—granular (i.e., framework), clustered, and fitted (i.e., mosaic) that have been observed globally (e.g., Moshier 1989; Kaczmarek et al. 2015). Importantly, the textural classes are characterized by distinct porosities, permeabilities, and pore-throat dimensions (Kaczmarek et al. 2015; Hashim and Kaczmarek 2019).
There is a general consensus that calcite microcrystals are diagenetic in origin and form through mineralogical stabilization of aragonite and high-Mg calcite (HMC) in shallow-marine sediments, as well as via recrystallization of calcite in deep-sea chalk sediments (e.g., Budd 1989; Moshier 1989; Munnecke et al. 1997; Fabricius 2007; Hasiuk et al. 2016). Most experimental, petrographic, and geochemical evidence is consistent with a model whereby stabilization to calcite occurs during early diagenesis via a dissolution–reprecipitation reaction (Budd 1989; Al-Aasm and Azmy 1996; Munnecke et al. 1997; Malone et al. 2001; Kaczmarek et al. 2015). For example, experimental studies have consistently shown that aragonite stabilizes to calcite microcrystals that are remarkably similar in size and shape to those observed in natural limestones (e.g., McManus and Rimstidt 1982; Papenguth 1991; Hashim and Kaczmarek 2020). Observations from Cenozoic sediments suggest that calcite microcrystals can form among aragonitic sediments in contact with meteoric fluids (Steinen 1982), and seawater-derived pore fluids (Melim et al. 2002; Malone et al. 2001). Geochemical data (Mg/Ca, Sr/Ca, δ13C, and δ18O) from a global collection of Phanerozoic limestones suggest that most calcite microcrystals in the rock record have formed in shallow burial and likely from marine-derived fluids (Hasiuk et al. 2016).
Despite the general consensus that calcite microcrystals are diagenetic, the genetic origins of the various microcrystal textures are widely debated (Budd 1989; Kaczmarek et al. 2015; Lucia 2017; Hashim and Kaczmarek 2019). Microcrystal textures have been attributed to the depositional characteristics of the precursor sediments such as mineralogy, size, and type (e.g., Lasemi and Sandberg 1993), diagenetic conditions of the stabilization process, such as fluid chemistry and fluid-to-solid ratio (e.g., Folk 1974; Moshier 1989), and diagenetic processes such as late-stage dissolution, cementation, and compaction (e.g., Lambert et al. 2006; Deville de Periere et al. 2011).
An experimental study by Hashim and Kaczmarek (2020) demonstrated that numerous depositional and diagenetic factors, such as reactant size and type, fluid chemistry, and fluid:solid ratio, impact the resultant texture of the stabilized calcite. They showed, for example, that polyhedral calcite crystals can form directly during stabilization of i) biogenic aragonitic allochems, such as ooids and corals or ii) powdered single-crystal aragonite in high-[Ca] solutions. Based on textural observations, similar polyhedral and rounded calcite microcrystals have previously been interpreted to reflect partial dissolution of initially euhedral and subhedral, rhombic calcite crystals by corrosive fluids during burial diagenesis (Lambert et al. 2006). It further was suggested by Lambert et al. (2006) that such dissolution can lead to large volumes of porosity generation in the subsurface. Although this dissolution hypothesis is commonly cited to explain the origin of rounded calcite microcrystals (e.g., Rosales et al. 2018; Tavakoli and Jamalian 2018; Valencia and Laya 2020), it has been criticized from multiple perspectives. In a global study of Phanerozoic limestones, Kaczmarek et al. (2015) showed that many calcite microcrystals described as rounded are in fact multifaceted polyhedral microcrystals exhibiting no compelling evidence of dissolution. These authors argued, therefore, that truly rounded calcite crystals are uncommon in limestones, and that multi-faceted polyhedral crystals more likely form during stabilization. The claim that large volumes of porosity are generated during burial dissolution was criticized by Ehrenberg et al. (2012, 2019), who argued that this model is unrealistic based on mass-balance considerations and geochemical constraints.
Calcite dissolution has been extensively investigated in the laboratory and in field settings. The vast majority of published studies focus on dissolution kinetics (Morse 1974b; Berner and Morse 1974; Rickard and Sjöberg 1983; Sjöberg and Rickard 1983, 1984; Walter and Morse 1985; Svensson and Dreybrodt 1992; Campton and Sanders 1993; Gutjahr et al. 1996; Arvidson et al. 2003, 2006; Subhas et al. 2015; Naviaux et al. 2019). Numerous studies have also reported on the nanometer-scale surface features resulting from calcite dissolution at near-equilibrium conditions (e.g., Lasaga and Blum 1986; MacInnis and Brantley 1992; Stipp et al. 1994; Liang et al. 1996; Arvidson et al. 2003, 2006; Friis et al. 2003). However, the overall morphology (i.e., texture) of calcite crystals subjected to dissolution conditions in the laboratory, and how it compares to the morphology of calcite crystals observed in natural limestones, have rarely been addressed (e.g., Berner and Morse 1974; Jones and Pemberton 1987). To bridge this knowledge gap, well-controlled laboratory experiments were employed to directly test the dissolution hypothesis, and to further explore the various geological factors that contribute to microcrystal texture.
METHODS
Experimental Procedure
Laboratory dissolution experiments were conducted using the pH-stat technique developed by Morse (1974a), which allows calcite dissolution to occur under a constant-saturation state (Ωcalcite). Keeping Ωcalcite constant can be attained by considering the dissolution of calcium carbonate according to the following equations:
![]()
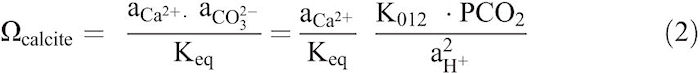
Where Ω = saturation state, a = activity, Keq = equilibrium constant for reaction (1), pCO2 = partial pressure of CO2, and K012 = the activity equilibrium constant for the following reaction:
![]()
Rearranging Equation 2 and using ![]() , gives,
, gives,
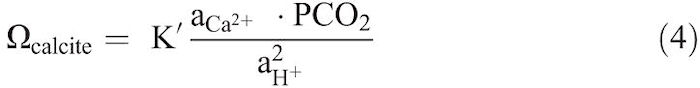
Equation 4 shows that in order to keep Ωcalcite constant during dissolution, aCa2+, pCO2, and aH+ must remain constant (Morse 1974a). In our dissolution experiments, pCO2 was held constant by bubbling gas-CO2 mixture of known composition through the solution. The pH of the solution, and thus aH+, was fixed by continuous addition of acid to compensate the H+ ions consumed during calcite dissolution. The aCa2+ is assumed to be nearly constant given that a negligibly small amount of Ca is added to the solution through calcite dissolution compared to the high amount of Ca originally present in the solution (Morse 1974a).
A schematic diagram of the pH-stat system is shown in Figure 1. The dissolution reaction of calcite takes place in a 900 mL Pyrex reaction vessel placed in a temperature bath set to a constant temperature. An overhead electric stirrer is used to continuously stir the reaction solution with a constant stirring rate that is fast enough to keep the calcite solid suspended in the solution. A gas bubbler is used to bubble air through the solution. The pH of the solution is monitored using an electrode attached to a pH controller. Before each experimental series, a three-point pH calibration was performed at pH 4, 7, and 10, using buffers traceable to NIST standards.
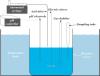 Fig. 1. A schematic diagram of the pH-stat system used for the dissolution experiments.
A predetermined pH value is set on the pH controller with a small hysteresis (dead band) to prevent oscillation around the set pH value. The pH of the solution is then brought as close as possible (within ∼ 0.2 pH units) to the set pH value on the low end by adding either Na2CO3 or HCl. A known mass of calcite is then added, marking the beginning of the dissolution experiment. When a predetermined value of pH is exceeded (due to calcite dissolution), the controller activates an automated syringe which injects HCl acid of known normality into the reaction vessel. The amount of acid injected is monitored and automatically recorded in real time, and is then used to calculate the dissolution rate based on the stoichiometry of Equation 1, and Equation 5 (Walter and Morse 1984):
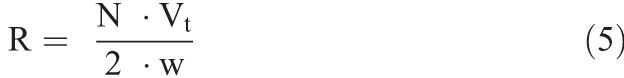
Where R = dissolution rate (mol.g–1.s–1), N = normality of acid (eq.L–1), Vt = volume of acid added per second (L.s–1), and w = initial weight of calcite (g). The dissolution rate can be normalized by the calcite reactant surface area according to the following equation:
Where s = surface area (cm2.g–1). When normalized by surface area, the dissolution rate unit is mol.s–1.cm–2. The percent calcite dissolved as a function of reaction time was then calculated using the following equation:
Where D = calcite dissolved (%), and M = molecular weight of calcite (g. mol–1).
All experiments were conducted at constant temperature of 25 °C, and pCO2 of 10–3.4. A 600 ± 10 mL of NaCl–CaCl2 containing the same [Ca] and ionic strength as seawater of average salinity was used as a reaction solution (Millero 2016), and 1 g of calcite reactant. A pipette was used to sample approximately 10 ± 2 mL of the reaction solution. The mixed fluid–solid sample was immediately separated using a vacuum flask, rinsed with distilled water, filtered, and the solid materials were dried in a vacuum desiccator at room temperature.
In total, eight experimental series were conducted, and each series was replicated at least once (Table 1). Ωcalcite in each series was set by fixing the pH at a specific value. The pH values used were 4 ± 0.2, 6 ± 0.1, 7 ± 0.05, and 7.5 ± 0.05, which correspond to Ωcalcite of 10–7.89, 10–3.90, 10–1.85, and 10–0.85, respectively. Note that under our experimental conditions, the pH value at which calcite is at equilibrium with the solution (Ωcalcite = 1) was 7.92. In all the series, sampling was done at 5%, 10%, and 30% calcite dissolved. This was possible because % calcite dissolved was calculated in real time (i.e., as dissolution was occurring) and was displayed on a computer screen. This was done through a computer program which uses as input (before the start of each experiment) acid normality and calcite reactant weight. The program receives the volume of acid added continuously from the automated syringe, and it uses Equation 7 to calculate % calcite dissolved.
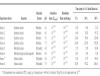 Table 1. Summary of experimental conditions and dissolution rates.*
It should be pointed out that the terminology used to describe the distance from equilibrium is relative. It has been previously established that below a pH of approximately 4–5, dissolution rate is linearly dependent on solution pH and independent of pCO2 (Plummer et al. 1979; Morse and Arvidson 2002). Above this pH range, dissolution rate becomes progressively independent on solution pH, and dissolution mechanisms vary in a complex manner as equilibrium is approached (Morse et al. 2007). The exact pH values separating these regions are poorly defined (Morse et al. 2007). Accordingly, we consider experiments conducted at pH = 4 to be far-from-equilibrium or high degree of undersaturation. In contrast, experiments conducted at both pH = 7 and 7.5 are considered near-equilibrium or low degree of undersaturation.
MATERIALS
Four types of calcite microcrystals were used as reactants in the dissolution experiments (Table 1). These include: i) synthetic calcite microcrystal precipitates (Sigma Aldrich; Series 1–4), ii) calcite microcrystal precipitates formed via stabilization of initially aragonitic corals (Series 5), iii) calcite microcrystals formed via stabilization of single crystal aragonite (SCA; Series 6), and iv) natural diagenetic calcite microcrystals (Series 7 and 8). All calcite microcrystals are euhedral, meaning that they are characterized by obvious, well-formed flat faces. Specific microcrystal texture is different between the series.
Material specifications from Sigma Aldrich report that the synthetic calcite is 99% pure. Our X-ray diffraction (XRD) analysis suggests that the synthetic material is a highly pure calcite. Scanning electron microscope (SEM) analysis showed that the synthetic calcite is composed of rhombic (euhedral) microcrystals ranging in diameter between 1 and 15 μm (Fig. 2A). Synthetic calcite has a BET surface area of 0.38 m2.g–1.
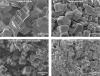 Fig. 2. SEM images of the various microcrystalline calcite reactants used in the dissolution experiments. A) Synthetic calcite (Series 1–4) composed of rhombic crystals. B) Calcite stabilized from aragonitic coral (Series 5) composed of polyhedral crystals. C) Calcite stabilized from single-crystal aragonite (Series 6) composed of euhedral rhombic crystals. D) Natural calcite from a drill core of Lower Cretaceous limestone (Series 7 and 8) composed of polyhedral crystals with some curved edges and corners.
The stabilized calcites were prepared by stabilizing pulverized (< 63 μm) corals and SCA at 200 °C in distilled water following the method described by Hashim and Kaczmarek (2020). XRD analysis showed that the stabilized corals and SCA are composed of approximately > 95% calcite and < 5% aragonite based on peak intensities (described below). SEM imaging showed that the calcite from stabilized corals is composed of polyhedral (multifaceted) microcrystals (Fig. 2B), whereas the calcite from the stabilized SCA is composed of rhombic microcrystals (Fig. 2C). Textural variations between these calcites have been previously discussed by Hashim and Kaczmarek (2020).
Natural diagenetic calcites were sampled from a drill core of Lower Cretaceous limestone (Shuaiba Fm.) from the U.A.E. (Budd 1989). Natural calcite samples were examined with SEM to characterize their texture, and those that were composed of polyhedral (multi-faceted) crystals were chosen for the dissolution experiments. The selected samples were then pulverized using an agate mortar and pestle and dry sieved to obtain a size fraction between 90 and 202 μm. This size fraction was chosen to broadly match the other calcite reactants, and to minimize the effects of surface area on dissolution rates (Walter and Morse 1985). Pulverization to a very fine size fraction was avoided because it may impact calcite micro-texture. SEM imaging showed that the natural calcite is composed of polyhedral crystals with no change in texture observed with progressive pulverization (Fig. 2D).
Surface Area, XRD, and SEM
A three-point BET (Brunauer et al. 1938) specific-surface-area analysis for the synthetic calcite was performed using Micromeritics TriStar II 3020 instrument equipped with a nitrogen gas purge. Standard powder XRD techniques were used to determine the mineralogy of the solid reactants. Powders were prepared with an agate mortar and pestle. Powders were then mounted on a boron-doped silicon P-type zero background diffraction plates and placed in a Bruker D2 Phaser Diffractometer with a CuKα anode. Relative abundances of aragonite and calcite were determined using the ratio of calcite 104 and aragonite 111 peak heights (h) after subtracting the background intensity (Milliman 1974):
SEM imaging was performed on a Field Emission JEOL 7500 using an accelerating voltage of 5 kV and a working distance of 6 ± 0.2 mm. Samples were coated with 10 nm of osmium to avoid charging effects. Crystals were described in terms of their overall morphology (e.g., rhombic, polyhedral, rounded), edges and corners (sharp vs. smooth, curved, or rounded), crystal surface features (dissolution pits, layers, and roughness), and inter-crystal boundaries. “Crystal” and “microcrystal” are used interchangeably to refer to micrometer-size calcite crystals measuring ≤ 10 μm consistent with the definition of Kaczmarek et al. (2015). This terminology will be consistently used throughout the article.
RESULTS
Dissolution Rates
Experimentally determined dissolution rates are summarized in Table 1 and are plotted as a function of pH in Figure 3A. The amount of calcite dissolved (%) as a function of reaction time for Series 1–4 is shown in Figure 3B. These data show that dissolution rates exhibit a strong inverse covariance with solution pH and a normal covariance with the degree of solution undersaturation with respect to calcite (Fig. 3A). Dissolution rate in Series 1 (pH = 4) is approximately two orders of magnitude faster than dissolution rate in Series 4 (pH = 7.5). Experiments conducted at the same pH but with different calcite reactants show considerable variability in dissolution rate, particularly at lower pH values (Fig. 3A).
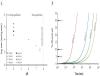 Fig. 3. A) Experimentally determined dissolution rates plotted as a function of solution pH. Dissolution rate increases with the decrease of solution pH. B) Semi-log plot of the percent of calcite dissolved calculated using Equation 7 for Series 1–4 as a function of reaction time.
While dissolution rates reported here are not normalized to reactant surface area, we measured the surface area of the synthetic calcite reactant used in Series 1–4 so that a direct comparison between our rates and those reported in previous studies is possible. The dissolution rate in Series 1 is 0.0018 mol.min–1.g–1. Normalizing by the synthetic calcite surface area of 3800 cm2.g–1 and converting the units yields a log dissolution rate of 4.40 mg.cm–2.yr–1, which is in a good agreement with the log dissolution rate of 4.36 mg.cm–2.yr–1 reported by Berner and Morse (1974) for a comparable reactant and dissolution conditions. The calculated log dissolution rate is also within the range of log dissolution rates of 3.48–4.48 mg.cm–2.yr–1 reported by Arvidson et al. (2003) based on a compilation of published data. It should be noted that the dissolution rate measured in our study, like all other bulk-chemistry studies, is a macroscopic rate. This rate represents an average of varied region-specific rates (different crystal faces, edges, corners, pits, etc.) (Noiriel et al. 2020).
Calcite Crystal Morphology
Some of the dissolution features described below are shown at high magnification in Figure 4. Series 1 (synthetic calcite, pH = 4) results show that after 5% calcite dissolution, the initially rhombic calcite microcrystals develop smooth edges and corners (Fig. 5A), but the crystals retain their original overall shape and do not become spherical. Inter-crystal boundaries are characterized by gulfs (sensu Lambert et al. 2006), which are defined as narrow grooves or channels between adjacent, touching crystals. In some cases, dissolution accentuates inter-crystal boundaries with the appearance of gulfs. In other cases, however, dissolution preferentially occurs at edges and corners as evidenced by the rounding, which tends to obscure the boundaries between touching crystals. As dissolution proceeds to 10%, crystals are still characterized by smooth edges and corners, and inter-crystal gulfs, and some crystal faces develop flat-bottomed, smooth-sided etch pits with shapes that vary between rectangular to irregular (Fig. 5B). At 30% dissolution, crystals are still characterized by smooth edges and corners, inter-crystal gulfs, and pits, but now some crystal edges and corners are characterized by narrow ledges (sensu Berner 1980) oriented parallel to one another in a stair-stepping fashion (Fig. 5C). Crystal surfaces are also rougher and bumpy in appearance due to what appears to be fine particles attached to the surfaces (Fig. 5C).
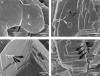 Fig. 4. High-magnification SEM images of partially dissolved calcite crystals showing some of the dissolution features discussed in this study. A) SEM image from Series 5 showing an inter-crystal gulf, which is defined as a narrow groove or channel between adjacent crystals (sensu Lambert et al. 2006). B) SEM image from Series 8 showing rectangular (white arrows) and irregular (black arrows) dissolution pits. C) SEM image from Series 3 showing dissolution layers on a calcite crystal surface. D) SEM image from Series 8 showing stair-stepping ledges on a calcite crystal edge.
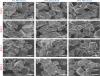 Fig. 5. SEM images of dissolved calcite crystals for Series 1–4 representing different degrees of fluid undersaturation with respect to calcite. Each horizontal row presents representative SEM images for one Series at 5%, 10%, and 30% dissolution. A) Series 1 (5% dissolution): crystals characterized by smooth edges and corners (white arrows), inter-crystal gulfs (black triangles), and rare etch pits (black arrows). B) Series 1 (10% dissolution): similar to Part A, crystals characterized by smooth edges and corners (white arrows), inter-crystal gulfs (black triangles), and etch pits (black arrows). C) Series 1 (30% dissolution): crystals characterized by smooth edges and corners (white arrows), and pits (black arrows), but crystals have a rougher appearance than in Parts A and B, and some crystal faces now characterized by narrow, parallel ledges (white triangles). D) Series 2 (5% dissolution): crystals characterized by dissolution layers and ledges (white triangles) and etch pits (black arrows). Some crystals develop slightly curved edges and corners (white arrows), but they remain rhombic. E) Series 2 (10% dissolution): similar to Part D, crystals characterized by slightly smooth edges and corners (white arrows), etch pits (black arrows), and ledges (white triangles) on crystal edges. F) Series 2 (30% dissolution): crystals characterized by slightly smooth edges and corners (white arrows), and etch pits (black arrows), but some crystals have more developed ledges than in Parts E and F. The ledges are irregular but parallel to one another and to crystal surfaces. G) Series 3 (5% dissolution): crystals characterized by rhombic morphology with sharp edges and corners, distinct dissolution layers (white triangles), and etch pits (black arrows). The etch pits are either rectangular in shape and oriented parallel to crystal surfaces or irregular and randomly oriented. H) Series 3 (10% dissolution): similar to Part G, crystals with sharp edges and corners and some pits (black arrows) but crystals are characterized by distinct dissolution layers and ledges (white triangles). I) Series 3 (30% dissolution): similar to Parts G and H, crystals characterized by ledges and dissolution layers (white triangles), and pits (black arrows), but crystal edges and corners become smoother and more curved (white arrows) than in Parts G and H. J) Series 4 (5% dissolution): crystals characterized by rhombic morphology with sharp edges and corners and distinct dissolution layers (white triangles). K) Series 4 (10% dissolution): similar to Part J, crystals characterized by rhombic morphology with sharp edges and corners and distinct dissolution layers (white triangles), but crystals develop dissolution pits (black arrows). L) Series 4 (30% dissolution): similar to Parts J and K, crystals characterized by rhombic morphology with sharp edges and corners, dissolution layers (white triangles), and pits (black arrows).
Series 2 (synthetic calcite, pH = 6) results show that after 5% calcite dissolution, crystals retain their original rhombic shape but are characterized by distinct layers on crystal surfaces that are either oriented parallel to the crystal faces or appear irregular in nature (Fig. 5D). Some crystals develop slightly smooth edges and corners, but the general morphology of these crystals remains rhombic (Fig. 5D). Etch pits similar to those observed in Series 1 are more common in Series 2. After 10% and 30% dissolution, ledges become increasingly pronounced (Fig. 5E, F). Similar to Series 1, crystal surfaces become rougher after 30% dissolution.
Series 3 and 4 (synthetic calcite, pH = 7 and 7.5, respectively) results show that after 5% calcite dissolution, crystals retain their rhombic shape with sharp edges and corners and crystal faces characterized by distinct layers (Fig. 5G, J). After 10 and 30% dissolution, layers become deeper and spaced farther apart (Fig. 5H, I, K). Smaller crystals are partially embedded in larger ones (Fig. 5H, I, K, L), which is more common in Series 4 than in Series 3. Etch pits are common in all Series 3 and 4 experiments after 5% dissolution. Some etch pits are rectangular in shape with some edges oriented parallel to the crystal faces (Fig. 5G, H), but with most appearing more randomly oriented (Fig. 5K). In both series, crystals commonly occur in clusters but the boundaries between individual crystals remain sharp and gulfs are not observed.
Collectively, the observations from Series 1–4 show that smooth edges and corners and inter-crystal gulfs are most developed in Series 1 and become progressively less pronounced and less common towards Series 4. Furthermore, smooth edges and corners and inter-crystal gulfs develop after 5% dissolution and continue to exist after 10% and 30% dissolution, but they do not become more common with further dissolution (Fig. 5). In contrast, etch pits, dissolution layers, and ledges are least developed in Series 1 and become progressively more common towards Series 4. These features typically appear after 5% dissolution and become increasingly more common and more visible with further dissolution (Fig. 5).
Series 5 (stabilized coral, pH = 4) results indicate that after 5% calcite dissolution, most of the initially polyhedral calcite crystals constituting the stabilized coral reactant (Fig. 2B) develop smooth, curved edges and corners, and etch pits similar to those observed in Series 1 (Fig. 6A). After 10% and 30% dissolution, crystals are still characterized by a few etch pits as well as crystal edges and corners that are smooth and curved, but inter-crystal boundaries are characterized by gulfs (Fig. 6B). Surface roughness also becomes more noticeable, though it does not appear to reflect the presence of etch pits or depressions but rather the occurrence of fine particles that make the surface bumpy (Fig. 6C). Some compromise boundaries between crystals remain sharp (Fig. 6A, C), similar to those observed in the undissolved reactants (Fig. 2B). Lacy, web, and strand-like structures are observed on and between some crystals (Fig. 6B).
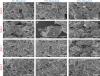 Fig. 6. SEM images of dissolved calcite crystals for Series 5–8 representing different types of calcite reactants and degrees of fluid undersaturation with respect to calcite. Each horizontal row presents representative SEM images for one Series at 5%, 10%, and 30% dissolution. A) Series 5 (5% dissolution): crystals characterized by smooth edges and corners (white arrows) and etch pits (black arrows). B) Series 5 (10% dissolution): similar to Part A, crystals characterized by smooth edges and corners (white arrows) and etch pits (black arrows), but now some inter-crystal boundaries develop gulfs (black triangles) while other boundaries are characterized by sharp borders. Webs and strands of organic matter (OM with white arrows) are observed on and between crystals. C) Series 5 (30% dissolution): similar to Parts A and B, crystals characterized by smooth edges and corners (white arrows), inter-crystal gulfs (black triangles), and etch pits (black arrows), but crystals have a rougher appearance than in Parts A and B. D) Series 6 (5% dissolution): crystals characterized by sharp edges and corners, and sharp-sided, irregular pits (black arrows). Aggregates of equant and elongated nanocrystals are observed (gray arrows). E) Series 6 (10% dissolution): crystals characterized by irregular but parallel dissolution layers (white triangles), as well as a few dissolution pits (black arrows). Crystal edges and corners are slightly smoother than in Part E. F) Series 6 (30% dissolution): crystals characterized by smooth edges and corners (white arrows), and rough crystal surfaces. G) Series 7 (5% dissolution): crystals characterized by fine ledges (white triangles), and some smooth edges and corners, but they remain polyhedral. H) Series 7 (10% dissolution): crystals still characterized by polyhedral morphology, and wider and more visible ledges (white triangles) than in Part G. I) Series 7 (30% dissolution): crystals characterized by smoother and more curved edges and corners compared to Parts G and H, but they remain polyhedral. J) Series 8 (5% dissolution): crystals characterized by polyhedral morphology and distinct, deep, parallel ledges (white triangles). K) Series 8 (10% dissolution): similar to Part J, crystals characterized by polyhedral morphology, but the ledges (white triangles) become wider and more visible, and rare pits (black arrows) are observed. L) Series 8 (30% dissolution): similar to Parts J and K, crystals characterized by polyhedral morphology and ledges (white triangles), but the ledges are more separated and thus more visible. Crystal surfaces develop small, sharp-sided, irregular, and randomly oriented dissolution pits (black arrows).
Series 6 (stabilized single crystal aragonite, pH = 4) results show that after 5% calcite dissolution, crystals remain euhedral with well-developed faces and sharp edges and corners, and some crystal surfaces develop sharp and irregular pits (Fig 6D). Some of the pits observed in Series 6 (Fig. 6E) are similar to those observed in other experiments (e.g., Fig. 6A), while some others differ significantly in their irregular shapes, larger sizes, pointed bottoms, and the fact that some of them occur in clusters (Fig. 6D). Aggregates of equant and elongated nanocrystals are also observed (Fig. 6D). After 10% calcite dissolution, crystal edges, corners, and surfaces develop layers (Fig. 6E). In most cases, the layers are broadly subparallel to one another, but the orientations of the steps between layers are highly irregular. A few small (< 0.2 μm in diameter) and irregular pits are observed on crystal surfaces (Fig. 6E). After 30% calcite dissolution, crystal surfaces become rough and some crystal corners become slightly curved, meaning that crystals themselves become less euhedral (Fig. 6F).
Series 7 (natural calcite, pH = 4) results indicate only subtle textural modifications are observed after 5% calcite dissolution (Fig. 2D). Calcite crystals remain polyhedral with flat faces, but some crystal edges and corners become slightly rounded and other edges develop fine ledges (Fig. 6G). After 10% calcite dissolution, the ledges become wider and thus more easily discernible, and crystal surfaces become rougher and uneven (Fig. 6H). Further dissolution to 30% yields crystals with smoother edges and corners, but the crystals largely remain polyhedral (Fig. 6I).
Series 8 (natural calcite, pH = 7.5) results show that after 5% calcite dissolution, crystal edges exhibit sharp and discrete ledges (Fig. 6J). In most cases, the ledges are parallel to one another and to crystal faces. After 10% dissolution, crystals remain generally polyhedral, but the ledges are more widely spaced (Fig. 6K). After 30% dissolution, ledges become even more widely spaced, and some crystal faces develop dissolution pits (Fig. 6L). Most of the pits are shallow and small, sharp-sided, and irregular in shape, and their orientation is highly variable.
High-resolution SEM images provide a more detailed look at the effects of dissolution. These images show that both synthetic and natural calcite dissolved under far-from-equilibrium conditions (Series 1 and 7, respectively) develop smooth and rounded crystal edges and corners (Fig. 7A, B) compared to synthetic and natural calcite dissolved under near-equilibrium conditions (Series 4 and 8, respectively), which develop ledges on crystal edges and corners (Fig. 7C, D). In the dissolution experiments conducted under far-from-equilibrium conditions, the edges and corners of the synthetic calcite crystals are smoother than those on natural calcite crystals (Fig. 7A, B). Additionally, the far-from-equilibrium dissolution experiments of the natural calcite reactant shows that the initially polyhedral crystals develop smooth edges and corners and the overall crystal morphology becomes more spherical, but the crystals retain their straight faces even after 30% calcite dissolution (Fig. 8).
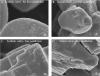 Fig. 7. High-resolution SEM images of synthetic and natural calcite crystals dissolved under far-from-equilibrium and near-equilibrium conditions. A, B) Calcite crystals characterized by smooth edges and corners, but edges and corners of the synthetic calcite crystal (Part A) are smoother than those of the natural calcite crystal (Part B). C, D) Calcite crystals characterized by sharp ledges and layers, but ledges and layers of the synthetic calcite crystal (Part C) are smoother than those of the natural calcite crystal (Part D).
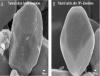 Fig. 8. High-resolution SEM images of a natural calcite crystal before and after dissolution under far-from-equilibrium conditions (Series 7). A) SEM image of natural calcite reactant showing an equant polyhedral crystal characterized by well-developed crystal faces and slightly smooth edges and corners. B) SEM image of natural calcite reactant after 30% dissolution under far-from-equilibrium conditions showing a nearly spherical crystal with smooth edges and corners, as well as well-developed crystal faces observed.
DISCUSSION
Transport-Controlled vs. Surface-Controlled Dissolution
How we interpret our data is ultimately guided by our conceptual understanding of mineral dissolution in aqueous solutions, which assumes the following processes: i) diffusion of reactants to the mineral surface, ii) physicochemical reactions at the mineral–fluid interface (i.e., ion exchange, surface diffusion, hydration, desorption, etc.) that ultimately lead to the detachment of ions, and iii) transport of products from the mineral surface to the bulk solution (Berner 1980; Rickard and Sjöberg 1983; Murphy et al. 1989; Morse and Arvidson 2002). Typically, one of these processes is slower than the others, and is thus referred to as the rate-limiting step because it governs the overall dissolution rate (Morse and Arvidson 2002). When reactions at the mineral surface are slower than diffusion of reactants or products, a reaction is considered surface-controlled. In contrast, reaction rates limited by diffusion are called transport-controlled reactions (Berner 1978, 1980). Which dissolution mechanism dominates depends on several factors, including the degree of undersaturation, hydrodynamic conditions, mineral solubility and reactivity, temperature, and the presence of kinetic inhibitors (Berner 1978; Morse and Berner 1979; Sjöberg and Rickard 1984; Svensson and Dreybrodt 1992; Morse et al. 2007). Whether dissolution is transport-controlled or surface-controlled dictates the type of dissolution features on the dissolving mineral (Berner 1980). It has previously been demonstrated that when dissolution occurs under high degrees of undersaturation (i.e., far-from-equilibrium), ion detachment is likely to be faster than ion transport, and thus dissolution is expected to be transport-controlled, whereas when dissolution occurs under low degrees of undersaturation (i.e., near-equilibrium), ion detachment is likely to be slower than ion transport, and thus dissolution is expected to be surface-controlled (Berner 1980; Sjöberg and Rickard 1983; Morse and Arvidson 2002). At intermediate degrees of undersaturation, a transition region has been inferred where dissolution is jointly controlled by ion transport and surface reactions (Sjöberg and Rickard 1983).
The experimental design of our study explicitly controls for several of the factors described above. First, all experiments were conducted at the same temperature. Second, the hydrodynamic component (diffusion and advection) is assumed to be constant across all dissolution experiments because the stirring rate is an experimental control. Third, our solutions are devoid of all known calcite dissolution inhibitors, such as magnesium (e.g., Arvidson et al. 2006), orthophosphate (e.g., Walter and Hanor 1979; Svensson and Dreybrodt 1992), strontium (e.g., Gutjahr et al. 1996), and organic compounds (e.g., Compton and Sanders 1993). Therefore, the observed differences in reaction rate and crystal texture can be confidently attributed to the only two experimental variables investigated: the degree of undersaturation and/or reactant type (Table 1).
Evolution of Crystal Morphology during Dissolution
Our data show that dissolution at high degree of undersaturation (Series 1, 5, 6, and 7) results in crystals with smooth and rounded edges and corners (Figs. 5A–C, 6A–C, G–I), implying that dissolution is mainly transport-controlled. High degrees of undersaturation lead to dissolution that occurs evenly across the crystal surface and preferentially along edges and corners because these features have more exposed reactive surface area compared to flat crystal faces (Berner 1978; Lasaga 2014). In contrast, dissolution at lower degrees of undersaturation (Series 3, 4, and 8) yields crystal surfaces characterized by etch pits, dissolution layers, and ledges (Figs. 5D–L, 6J–L), suggesting that dissolution is surface-controlled. Low degrees of undersaturation promote selective dissolution at excess energy sites such as point defects, dislocations (edge and screw), and steps and kinks (Berner 1978; Morse and Arvidson 2002; Lasaga 2014). Note that in Series 1 (pH = 4), where dissolution occurred at high degree of undersaturation, few dissolution pits were observed (Fig. 5B, C), implying that dissolution was perhaps not purely transport-controlled, but is more likely jointly controlled by transport and surface processes (Sjöberg and Rickard 1983). Dissolution in Series 2 (pH = 6) also led to the formation of pits and ledges as well as slightly smooth edges and corners on the dissolving crystals (Fig. 5D–F), suggestive of dissolution controlled by both transport and surface reactions.
The results from Series 6 are inconsistent with this interpretation in that the solution was highly undersaturated, yet calcite crystals did not initially develop rounded edges and corners (Fig. 6D–F) as they did in Series 1, 6, and 7, which had the same solution chemistry but different reactant types. We attribute this discrepancy to the possible presence of small remnants of aragonite with the calcite stabilized from single-crystal aragonite (SCA) that was used as a reactant in Series 6. XRD diffractograms confirm that the stabilized SCA used in Series 6 contained a small amount of aragonite. Given that aragonite is more soluble than calcite (Morse et al. 1980) and generally has faster dissolution kinetics (Walter and Morse 1985), aragonite would have reacted faster, and after 5% dissolution, only very little of the calcite may have dissolved. In fact, SEM observations suggest the presence of finely crystalline material that differs in appearance from calcite (Fig. 6D) that could be small remnants of partially dissolved aragonite, though this could not be confirmed with XRD due to the lack of sufficient sample size following the dissolution experiments. Aragonite remnants in the stabilized SCA calcite can also explain the irregular pits observed on calcite crystal surfaces (Fig. 6D), which are similar to the aragonite relics reported in diagenetic calcite crystals in natural settings interpreted to have been stabilized from aragonite (e.g., Sandberg et al. 1973; Steinen 1982; Lasemi and Sandberg 1993; Munnecke et al. 1997). This explanation is also consistent with the observation that Series 6 samples taken from the 10% and 30% dissolution experiments had calcite crystals that were more rounded with slightly curved edges and corners, which is predicted from transport-controlled dissolution expected at higher degrees of undersaturation (Fig. 6F).
Comparison between synthetic and natural calcites dissolved at the same high degree of undersaturation (Series 1 and 7, respectively) shows that dissolved natural calcite crystals are less rounded and have more ledges (Fig. 6C, G–I,) compared to dissolved synthetic calcite crystals (Fig. 5A–C, 6A). This observation suggests that surface reactions were slower during dissolution and that natural calcite is less reactive than the synthetic calcite. Numerous factors, such as crystallinity, texture, defect density, and the presence of organic compounds and chemical inhibitors, have been shown to influence mineral reactivity and thus dissolution rates in natural calcites (e.g., Morse 1974b; Naviaux et al. 2019). The observation that natural calcite dissolved slower than synthetic calcite (Fig. 3A) also supports the claim that the natural calcite is less reactive. The fact that natural calcite reactants were coarser than the synthetic calcite reactants (and thus had lower reactive surface area), however, could also explain the lower dissolution rate for natural calcite. An inverse relationship between reactant size and dissolution rate is well established in the literature (e.g., Walter and Morse 1985; Morse and Arvidson 2002; Subhas et al. 2015).
Do Rounded Calcite Microcrystals in Natural Limestones Indicate Dissolution?
Based on textural evidence from a microporous Cretaceous limestone from Iraq (Mishrif Fm.), Lambert et al. (2006) proposed that rounded calcite microcrystals with inter-crystal gulfs reflect partial dissolution of rhombic and polyhedral crystals during burial diagenesis, an explanation consistent with some of our experimental observations. For example, our experiments show that partial dissolution of rhombic and polyhedral calcite crystals under a high degree of undersaturation yields crystals with rounded edges and corners, as well as inter-crystal gulfs (Figs. 5A–C, 6A–C, G–I).
Despite this agreement, multiple lines of evidence suggest that rounded crystals should not be used alone as evidence for post-stabilization dissolution of calcite. First, Kaczmarek et al. (2015) noted that many of the microcrystals described by others as rounded do not actually exhibit strong evidence of roundness at crystal edges and corners. Rather, many of the microcrystals appear polyhedral (i.e., multi-faceted) with sharp edges and flat crystal faces. Second, Hashim and Kaczmarek (2020) recently demonstrated in laboratory experiments that polyhedral crystals with rounded edges and corners can form directly during mineralogical stabilization from aragonite to calcite. Given that the chemical conditions of these experiments did not permit dissolution of calcite to occur, rounded calcite microcrystal shape does not appear to be conclusive evidence for dissolution of a euhedral calcite precursor. Based on observations from natural limestones by Lambert et al. (2006) and our own experiments on calcite microcrystal dissolution (Figs. 5A–C, 6A–C), inter-crystal gulfs may serve as better evidence for dissolution because they are the one textural feature that develops only during dissolution.
If we accept that calcite microcrystals with rounded edges and corners and inter-crystal gulfs, like those reported by Lambert et al. (2006), are produced during dissolution, what was the shape or texture of the calcite precursor? If one assumes that fitted textures that are characterized by a dense mosaic of closely packed crystals (Moshier 1989; Kaczmarek et al. 2015) are unlikely to produce a loose framework of rounded crystals upon dissolution, the two remaining candidate textures are granular euhedral and granular subhedral (Kaczmarek et al. 2015). The most abundant (35% relative abundance) calcite microcrystal texture in Phanerozoic limestones is the granular subhedral, which is characterized by polyhedral and rounded microcrystals, whereas the granular euhedral, which is characterized by rhombic microcrystals, is less abundant (10%) (Kaczmarek et al. 2015). Perhaps the reason rhombic microcrystals are less abundant in ancient limestones is that many have experienced partial dissolution and became polyhedral, which implies that dissolution is much more common than generally thought. However, our data show that when dissolved under a high degree of undersaturation, the synthetic calcite rhombic crystals (Series 1), developed rounded edges and corners as well as inter-crystal gulfs. But the microcrystals themselves did not become spherical (Fig. 5A–C). In contrast, when dissolved under a high degree of undersaturation, the natural calcite polyhedral crystals (Series 7), and to a lesser degree, the coral polyhedral crystals (Series 5), not only developed rounded edges and corners, but the microcrystals became nearly spherical (Figs. 6G–I, A–C, 8). These reactants likely became more spherical with progressive dissolution because their initial equidimensional shape (Figs. 2B, D, 8A) already approximates a spherical form. The synthetic calcite microcrystals, in contrast, are initially rhombic with a longer c-axis dimension (Fig. 2A), which upon dissolution is more likely to produce elongate crystals with rounded edges and corners as was observed here (Fig. 5A–C). Lastly, as noted in Kaczmarek et al. (2015), the calcite microcrystals shown in Lambert et al. (2006) are polyhedral with well-developed crystal faces rather than rounded, an observation that may provide strong evidence of the precursor shape: that the co-occurrence of polyhedral and rounded calcite in the rock record may represent a direct link between the two textures, demonstrating that calcite with rounded edges and corners, and inter-crystal gulfs most likely formed via partial dissolution of a polyhedral precursor. This is supported by the observation that, upon dissolution, the natural polyhedral crystals developed smooth edges and corners and become more spherical, but they retained their well-developed, straight edges (Fig. 8). Taken collectively, these observations suggest that the precursor of rounded crystals is more likely to be equant polyhedral crystals, and not euhedral (micro-rhombic) calcite microcrystals as proposed by Lambert et al. (2006).
The Burial-dissolution Model
To explain their observations of rounded calcite microcrystals with inter-crystal gulfs in a Cretaceous limestone, Lambert et al. (2006) invoked corrosive fluids associated with oil migration during burial diagenesis. Many other studies following Lambert et al. (2006) have invoked the dissolution hypothesis based mainly on petrographic data and paragenetic relationships (e.g., Feng et al. 2013; Rosales et al. 2018; Tavakoli and Jamalian 2018; Valencia and Laya 2020). Whereas our data broadly support the hypothesis that rounded crystal shape and inter-crystal gulfs may indicate dissolution, the specific conditions, mechanisms, and timing of large-scale dissolution in nature are highly debated (Ehrenberg et al. 2012, 2019). Although a discussion on all aspects of the burial-dissolution model is beyond the scope of the current study, an examination of potential dissolution mechanisms can provide some constraints on the burial-dissolution model.
The observation that rounded crystals with inter-crystal gulfs only formed in experiments where dissolution was transport-controlled, which was obtained by using high degrees of undersaturation (Series 1, 5, and 7) suggest that, in natural settings, a specific set of chemical conditions, namely highly acidic pore fluids, may be required to produce rounded microcrystals. The presence of kinetic inhibitors in natural waters has also been shown to exert control on dissolution reactions (Morse 1974b, Morse and Arvidson 2002). More specifically, kinetic inhibitors, such as magnesium (e.g., Arvidson et al. 2006), orthophosphate (e.g., Walter and Hanor 1979; Svensson and Dreybrodt 1992), strontium (e.g., Gutjahr et al. 1996), and organic compounds (e.g., Compton and Sanders 1993), may retard surface reactions during dissolution. This suggests that, in natural settings, where kinetic inhibitors are abundant, an even higher degree of undersaturation would be required to promote transport-controlled dissolution.
Hydrodynamic conditions also play a crucial role in determining the minimum degree of undersaturation required for transport-controlled dissolution (Berner 1978). The simplest way to promote transport-controlled dissolution is with a high degree of undersaturation so that surface reactions are faster than ion transport. Transport-controlled reactions can also be promoted with a slow stirring rate, so that ion transport is slower than surface reactions. In all our experiments, we employed a much higher stirring rate than expected in most geologic environments, which meant that to achieve transport-controlled dissolution, a very high degree of undersaturation (pH = 4) was required. We speculate that if calcite crystal dissolution occurred under slower stirring rates, a lower degree of undersaturation (i.e., closer to equilibrium) would be sufficient to achieve transport-controlled dissolution, and thus produce crystals with rounded edges and corners. If dissolution in natural environments occurred during deep-burial diagenesis, as suggested by Lambert et al. (2006), one would expect the microporous limestone to have a relatively low permeability, and thus limited fluid flow (stirring rate in the laboratory is a proxy to fluid flow in nature). This means that the degree of undersaturation required for transport-controlled dissolution, and thus production of crystals with rounded edges and corners, would be lower than what was required in our experiments. It is worth mentioning here that numerous studies have investigated calcite dissolution under near-equilibrium conditions (e.g., Stipp et al. 1994; Liang et al. 1996; Friis et al. 2003; Arvidson et al. 2006). Yet, most of these studies employ fast enough stirring rates so that dissolution is controlled by surface reactions (e.g., Arvidson et al. 2006; Xu and Higgins 2011).
Our ability to predict reaction mechanisms is extremely limited because dissolution, diffusion, and advection rates in natural settings are rarely known (e.g., Berner 1978). That being said, the presence of rounded crystals with inter-crystal gulfs, and the lack of dissolution pits and ledges (Lambert et al. 2006), suggest that dissolution was transport-controlled.
The claim that dissolution can lead to significant porosity generation in burial settings (e.g., Lambert et al. 2006; Swart et al. 2016; Rosales et al. 2018) also requires additional evaluation. For example, Lambert et al. (2006) suggested that approximately 8–13% porosity is generated as a result of burial dissolution based on, i) difference in average porosity between samples characterized by rounded crystals and those characterized by rhombic crystals, and ii) an inverse relationship between porosity and average crystal diameter. This claim was criticized by Ehrenberg et al. (2012) based on mass-balance considerations and geochemical constraints. First, Ehrenberg et al. demonstrated that a reduction in crystal diameter from 4.5 μm to 3 μm, as implied by the data of Lambert et al. (2006), would result in a 71% loss of solid material, which is unrealistic. Second, they showed that the trend of porosity vs. crystal diameter from Lambert et al. (2006), when extrapolated, would result in only 64% porosity when crystal size is equal to zero, which implies that cementation must have taken place in other parts of the reservoir. Accordingly, Ehrenberg et al. (2012) concluded that an 8–13% increase in porosity is too high. Our data show that after only 5% dissolution, calcite crystals developed rounded edges and corners and inter-crystal gulfs (Figs. 5A, 6A). This means that burial dissolution in natural limestones need not mean extensive porosity generation because crystals exhibiting evidence of dissolution (i.e., rounded edges and corners and inter-crystal gulfs) may occur after only minor dissolution. This conclusion is also supported by the observation that most of the crystals reported by Lambert et al. (2006) are not rounded but rather polyhedral, which suggests that the rock has probably experienced slight dissolution only.
Textural Criteria for Recognizing Dissolution
Carbonate dissolution is common in a wide range of natural environments, and it is significant in numerous critical topics, including the fate of anthropogenic CO2, global geochemical cycles, and carbonate-reservoir properties (Morse and Arvidson 2002). Although the discussion above focuses on calcite microcrystal dissolution in burial settings, our experimental results are broadly applicable to other natural environments where calcite dissolution may take place. For example, calcite dissolution may occur within the water column (Milliman et al. 1999), at the sediment–water interface (Subhas et al. 2019), within sediments during early diagenesis (Malone et al. 2001), burial diagenesis (Lambert et al. 2006), and potentially as a result of CO2 sequestration in deep carbonate reservoirs (Pokrovsky et al. 2009). Additionally, and perhaps most importantly, carbonate dissolution in the ![]() ocean
ocean![]() is expected to become more pervasive due to the falling saturation state with respect to carbonate minerals as a result of rising CO2 concentrations (i.e.,
is expected to become more pervasive due to the falling saturation state with respect to carbonate minerals as a result of rising CO2 concentrations (i.e., ![]() ocean
ocean![]()
![]() acidification
acidification![]() ) (Kleypas et al. 1999; Morse et al. 2006). While calcite microcrystals are not a major component of marine carbonate sediments in modern environments (e.g., Gischler et al. 2013; Hashim and Kaczmarek 2019), the dissolution features described here (pits, ledges, rounding, etc.) are not unique to calcite microcrystals, and have been shown to develop during the dissolution of other carbonate components (Berner 1978; Hover et al. 2001; Arvidson et al. 2003; Noiriel et al. 2020). For example, Hover et al. (2001) examined Holocene carbonates using high-resolution imaging and observed pits on high-Mg calcite crystals and rounded terminations on aragonite needles, which they ascribed to dissolution.
) (Kleypas et al. 1999; Morse et al. 2006). While calcite microcrystals are not a major component of marine carbonate sediments in modern environments (e.g., Gischler et al. 2013; Hashim and Kaczmarek 2019), the dissolution features described here (pits, ledges, rounding, etc.) are not unique to calcite microcrystals, and have been shown to develop during the dissolution of other carbonate components (Berner 1978; Hover et al. 2001; Arvidson et al. 2003; Noiriel et al. 2020). For example, Hover et al. (2001) examined Holocene carbonates using high-resolution imaging and observed pits on high-Mg calcite crystals and rounded terminations on aragonite needles, which they ascribed to dissolution.
As demonstrated here, dissolution features on partially dissolved calcite microcrystals may help identify the occurrence of dissolution in natural environments and assess whether dissolution is surface controlled or transport controlled. This is particularly important when sampling of pore fluids is not possible or in open systems where fluid chemistry is continuously evolving. While carbonate dissolution has been extensively studied in the laboratory (e.g., Morse 1974b; Arvidson et al. 2003; Naviaux et al. 2019), textural changes of the dissolving material have received little attention. Future work is needed to document textural evolution during dissolution of common carbonate components in modern sediments, which will help us constrain carbonate dissolution in natural environments, particularly as a consequence of ![]() ocean
ocean![]()
![]() acidification
acidification![]() .
.
CONCLUSIONS
Our experiments show that dissolution of rhombic and polyhedral calcite microcrystals under far-from-equilibrium conditions yields microcrystals with rounded edges and corners, inter-crystal gulfs, and rare dissolution pits. Dissolution of rhombic and polyhedral calcite microcrystals under near-equilibrium conditions, in contrast, yields microcrystals with sharp edges and corners, as well as abundant dissolution pits, layers, and ledges. These observations are consistent with the general understanding that dissolution under far-from-equilibrium conditions is transport-controlled, whereas dissolution under near-equilibrium conditions is surface-controlled. These data are also consistent with the interpretation that limestones with calcite microcrystals characterized by rounded edges and corners, and inter-crystal gulfs, form through partial dissolution during burial diagenesis.
Our data also show that while the rhombic calcite crystals may develop rounded edges and corners when dissolved under high degrees of undersaturation, the crystals remain elongated, and do not become spherical. In contrast, polyhedral crystals not only developed rounded edges and corners when dissolved under high degrees of undersaturation, but became nearly spherical. These observations suggest that the precursor of rounded microcrystals in microporous limestones is more likely to be equant polyhedral crystals, and not euhedral rhombic calcite crystals as has been previously proposed. Lastly, the observation that calcite crystals developed rounded edges and corners and inter-crystal gulfs after only 5% dissolution indicates that the presence of such features in natural limestones need not mean significant porosity generation.
References
Al-Aasm, I.S., and Azmy, K.K., 1996, Diagenesis and evolution of microporosity of Middle–Upper Devonian Kee Scarp Reefs, Norman Wells, Northwest Territories, Canada: petrographic and chemical evidence: American Association of Petroleum Geologists, Bulletin, v. 80, p. 82– 100.
Arvidson, R.S., Ertan, I.E., Amonette, J.E., and Luttge, A., 2003, Variation in calcite dissolution rates: a fundamental problem?: Geochimica et Cosmochimica acta, v. 67, p. 1623– 1634.
Arvidson, R.S., Collier, M., Davis, K.J., Vinson, M.D., Amonette, J.E., and Luttge, A., 2006, Magnesium inhibition of calcite dissolution kinetics: Geochimica et Cosmochimica Acta, v. 70, p. 583– 594.
Berner, R.A., and Morse, J.W., 1974, Dissolution kinetics of calcium carbonate in sea water IV, theory of calcite dissolution: American Journal of Science, v. 274, p. 108– 134.
Berner, R.A., 1978, Rate control of mineral dissolution under earth surface conditions: American Journal of Science, v. 278, p. 1235– 1252.
Berner, R.A., 1980, Early Diagenesis: A Theoretical Approach (No. 1): Princeton University Press, 241 p.
Brunauer, S., Emmett, P.H., and Teller, E., 1938, Adsorption of gases in multimolecular layers: American Chemical Society, Journal, v. 60, p. 309– 319.
Budd, D.A., 1989, Micro-rhombic calcite and microporosity in limestones: a geochemical study of the Lower Cretaceous Thamama Group, UAE: Sedimentary Geology, v. 63, p. 293– 311, doi:10.1016/0037-0738(89)90137-1.
Cantrell, D.L., and Hagerty, R.M., 1999, Microporosity in Arab formation carbonates, Saudi Arabia: GeoArabia, v. 4, p. 129– 154.
Compton, R.G., and Sanders, G.H.W., 1993, The dissolution of calcite in aqueous acid: the influence of humic species: Journal of Colloid and Interface Science, v. 158, p. 439– 445.
Deville de Periere, M., Durlet, C., Vennin, E., Lambert, L., Caline, B., Bourillot, R., and Poli, E., 2011, Morphometry of micrite particles in cretaceous microporous limestones of the Middle East: influence on reservoir properties: Marine and Petroleum Geology, v. 28, p. 1727– 1750, doi:10.1016/j.marpetgeo.2011.05.002.
Ehrenberg, S.N., Walderhaug, O., and Bjørlykke, K., 2012, Carbonate porosity creation by mesogenetic dissolution: reality or illusion?: American Association of Petroleum Geologists, Bulletin, v. 96, p. 217– 233.
Ehrenberg, S.N., Walderhaug, O., and Bjørlykke, K., 2019, Discussion of “Microfacies, diagenesis and oil emplacement of the Upper Jurassic Arab-D carbonate reservoir in an oil field in central Saudi Arabia (Khurais Complex)” by Rosales et al. (2018): Marine and Petroleum Geology, v. 100, p. 551– 553.
Fabricius, I.L., 2007, Chalk: composition, diagenesis and physical properties: Geological Society of Denmark, Bulletin, v. 55, p. 97– 128.
Feng, J., Cao, J., Hu, K., Peng, X., Chen, Y., Wang, Y., and Wang, M., 2013, Dissolution and its impacts on reservoir formation in moderately to deeply buried strata of mixed siliciclastic–carbonate sediments, northwestern Qaidam Basin, northwest China: Marine and Petroleum Geology, v. 39, p. 124– 137.
Folk, R.L., 1974, The natural history of crystalline calcium carbonate; effect of magnesium content and salinity: Journal of Sedimentary Petrology, v. 44, p. 40– 53.
Friis, A.K., Davis, T.A., Figueira, M.M., Paquette, J., and Mucci, A., 2003: Influence of Bacillus subtilis cell walls and EDTA on calcite dissolution rates and crystal surface features: Environmental Science and Technology, v. 37, p. 2376– 2382.
Gischler, E., Dietrich, S., Harris, D., Webster, J.M., and Ginsburg, R.N., 2013, A comparative study of modern carbonate mud in reefs and carbonate platforms: mostly biogenic, some precipitated: Sedimentary Geology, v. 292, p. 36– 55.
Gutjahr, A., Dabringhaus, H., and Lacmann, R., 1996, Studies of the growth and dissolution kinetics of the CaCO3 polymorphs calcite and aragonite: II. The influence of divalent cation additives on the growth and dissolution rates: Journal of Crystal Growth, v. 158, p. 310– 315.
Hashim, M.S., and Kaczmarek, S.E., 2019, A review of the nature and origin of limestone microporosity: Marine and Petroleum Geology, v. 107, p. 527– 554.
Hashim, M.S., and Kaczmarek, S.E., 2020, Experimental stabilization of carbonate sediments to calcite: insights into the depositional and diagenetic controls on calcite microcrystal texture: Earth and Planetary Science Letters, v. 538, no. 116235.
Hasiuk, F.J., Kaczmarek, S.E., and Fullmer, S.M., 2016, Diagenetic origins of the calcite microcrystals that host microporosity in limestone reservoirs: Journal of Sedimentary Research, v. 86, p. 1163– 1178.
Hover, V.C., Walter, L.M., and Peacor, D.R., 2001, Early marine diagenesis of biogenic aragonite and Mg-calcite: new constraints from high-resolution STEM and AEM analyses of modern platform carbonates: Chemical Geology, v. 175, p. 221– 248.
Jones, B., and Pemberton, S.G., 1987, The role of fungi in the diagenetic alteration of spar calcite: Canadian Journal of Earth Sciences, v. 24, p. 903– 914.
Kaczmarek, S.E., Fullmer, S.M., and Hasiuk, F.J., 2015, A universal classification scheme for the microcrystals that host limestone microporosity: Journal of Sedimentary Research, v. 85, p. 1197– 1212.
Kleypas, J.A., Buddemeier, R.W., Archer, D., Gattuso, J.P., Langdon, C., and Opdyke, B.N., 1999, Geochemical consequences of increased atmospheric carbon dioxide on coral reefs: Science, v. 284, p. 118– 120.
Lambert, L., Durlet, C., Loreau, J.P., and Marnier, G., 2006, Burial dissolution of micrite in Middle East carbonate reservoirs (Jurassic–Cretaceous): keys for recognition and timing: Marine and Petroleum Geology, v. 23, p. 79– 92.
Lasaga, A.C., 2014, Kinetic Theory in the Earth Sciences: Princeton University Press, 781 p.
Lasaga, A.C., and Blum, A.E., 1986, Surface chemistry, etch pits and mineral–water reactions: Geochimica et Cosmochimica Acta, v. 50, p. 2363– 2379.
Lasemi, Z., and Sandberg, P.A., 1993, Microfabric and compositional clues to dominant mud mineralogy of micrite precursors: Frontiers in Sedimentary Geology, v. 6, p. 173– 185.
Liang, Y., Baer, D.R., McCoy, J.M., Amonette, J.E., and Lafemina, J.P., 1996, Dissolution kinetics at the calcite–water interface: Geochimica et Cosmochimica Acta, v. 60, p. 4883– 4887.
Lucia, F.J., 2017, Observations on the origin of micrite crystals: Marine and Petroleum Geology, v. 86, p. 823– 833.
MacInnis, I.N., and Brantley, S.L., 1992, The role of dislocations and surface morphology in calcite dissolution: Geochimica et Cosmochimica Acta, v. 56, p. 1113– 1126.
Malone, M.J., Slowey, N.C., and Henderson, G.M., 2001, Early diagenesis of shallow-water periplatform carbonate sediments, leeward margin, Great Bahama Bank (![]() Ocean
Ocean![]() Drilling Program Leg 166): Geological Society of America, Bulletin, v. 113, p. 881– 894.
Drilling Program Leg 166): Geological Society of America, Bulletin, v. 113, p. 881– 894.
McManus, K.M., and Rimstidt, J.D., 1982, Aqueous aragonite to calcite transformation: a geometry controlled dissolution–precipitation reaction [Abstract]: Geological Society of America, Abstract with Programs, v. 14, p. 562.
Melim, L.A., Westphal, H., Swart, P.K., Eberli, G.P., and Munnecke, A., 2002, Questioning carbonate diagenetic paradigms: evidence from the Neogene of the Bahamas: Marine Geology, v. 185, p. 27– 53.
Millero, F.J., 2016, Chemical Oceanography: Boca Raton, CRC Press, 496 p.
Milliman, J.D., 1974, Marine Carbonates, Part 1: Recent Sedimentary Carbonates: New York, Springer-Verlag, 375 p.
Milliman, J.D., Troy, P.J., Balch, W.M., Adams, A.K., Li, Y.H., and Mackenzie, F.T., 1999, Biologically mediated dissolution of calcium carbonate above the chemical lysocline?: Deep Sea Research Part I, Oceanographic Research Papers, v. 46, p. 1653– 1669.
Morse, J.W., Mucci, A., and Millero, F.J., 1980, The solubility of calcite and aragonite in seawater of 35%. salinity at 25 °C and atmospheric pressure: Geochimica et Cosmochimica Acta, v. 44, p. 85– 94.
Morse, J.W., 1974 a, Dissolution kinetics of calcium carbonate in sea water III, a new method for the study of carbonate reaction kinetics: American Journal of Science, v. 274, p. 97– 107.
Morse, J.W., 1974 b, Dissolution kinetics of calcium carbonate in sea water V, effects of natural inhibitors and the position of the chemical lysocline: American Journal of Science, v. 274, p. 638– 647.
Morse, J.W., and Arvidson, R.S., 2002, The dissolution kinetics of major sedimentary carbonate minerals: Earth-Science Reviews, v. 58, p. 51– 84.
Morse, J.W., and Berner, R.C., 1979, Chemistry of calcium carbonate in the deep oceans: American Chemical Society, Symposium Series, v. 93, p. 499– 535.
Morse, J.W., Andersson, A.J., and Mackenzie, F.T., 2006, Initial responses of carbonate-rich shelf sediments to rising atmospheric pCO2 and “![]() ocean
ocean![]()
![]() acidification
acidification![]() ”: role of high Mg-calcites: Geochimica et Cosmochimica Acta, v. 70, p. 5814– 5830.
”: role of high Mg-calcites: Geochimica et Cosmochimica Acta, v. 70, p. 5814– 5830.
Morse, J.W., Arvidson, R.S., and Lüttge, A., 2007, Calcium carbonate formation and dissolution: Chemical reviews, v. 107, p. 342– 381.
Moshier, S.O., 1989, Microporosity in micritic limestones: a review: Sedimentary Geology, v. 63, p. 191– 213.
Munnecke, A., Westphal, H., Reijmer, J.J., and Samtleben, C., 1997, Microspar development during early marine burial diagenesis: a comparison of Pliocene carbonates from the Bahamas with Silurian limestones from Gotland (Sweden): Sedimentology, v. 44, p. 977– 990.
Murphy, W.M., Oelkers, E.H., and Lichtner, P.C., 1989, Surface reaction versus diffusion control of mineral dissolution and growth rates in geochemical processes: Chemical Geology, v. 78, p. 357– 380.
Noiriel, C., Oursin, M., and Daval, D., 2020, Examination of crystal dissolution in 3D: a way to reconcile dissolution rates in the laboratory?: Geochimica et Cosmochimica Acta, v. 273, p. 1– 25.
Papenguth, H.W., 1991, Experimental diagenesis of lime mud [Ph.D. Dissertation]: University of Illinois, Urbana–Champaign, 236 p.
Pokrovsky, O.S., Golubev, S.V., Schott, J., and Castillo, A., 2009, Calcite, dolomite and magnesite dissolution kinetics in aqueous solutions at acid to circumneutral pH, 25 to 150 °C and 1 to 55 atm pCO2: new constraints on CO2 sequestration in sedimentary basins: Chemical Geology, v. 265, p. 20– 32.
Plummer, L.N., Parkhurst, D.L., and Wigley, T.M.L., 1979, Critical review of the kinetics of calcite dissolution and precipitation: American Chemical Society, Symposium Series, v. 93, p. 537– 573.
Rickard, D.T., and Sjöberg, E.L., 1983, Mixed kinetic control of calcite dissolution rates: American Journal of Science, v. 283, p. 815– 830.
Rosales, I., Pomar, L., and Al-Awwad, S.F., 2018, Microfacies, diagenesis and oil emplacement of the Upper Jurassic Arab-D carbonate reservoir in an oil field in central Saudi Arabia (Khurais Complex): Marine and Petroleum Geology, v. 96, p. 551– 576.
Sandberg, P.A., Schneidermann, N., and Wunder, S.J., 1973, Aragonitic ultrastructural relics in calcite-replaced Pleistocene skeletons: Nature Physical Science, v. 245, p. 133– 134.
Sjöberg, E.L., and Rickard, D., 1983, The influence of experimental design on the rate of calcite dissolution: Geochimica et Cosmochimica Acta, v. 47, p. 2281– 2285.
Sjöberg, E.L., and Rickard, D.T., 1984, Temperature dependence of calcite dissolution kinetics between 1 and 62 C at pH 2.7 to 8.4 in aqueous solutions: Geochimica et Cosmochimica Acta, v. 48, p. 485– 493.
Steinen, R.P., 1982, SEM observations on the replacement of Bahaman aragonitic mud by calcite: Geology, v. 10, p. 471– 475.
Stipp, S.L.S., Eggleston, C.M., and Nielsen, B.S., 1994, Calcite surface structure observed at microtopographic and molecular scales with atomic force microscopy (AFM): Geochimica et Cosmochimica Acta, v. 58, p. 3023– 3033.
Subhas, A.V., Rollins, N.E., Berelson, W.M., Dong, S., Erez, J., and Adkins, J.F., 2015, A novel determination of calcite dissolution kinetics in seawater: Geochimica et Cosmochimica Acta, v. 170, p. 51– 68.
Subhas, A.V., McCorkle, D.C., Quizon, A., McNichol, A.P., and Long, M.H., 2019, Selective preservation of coccolith calcite in Ontong-Java Plateau sediments: Paleoceanography and Paleoclimatology, v. 34, p. 2141– 2157.
Svensson, U., and Dreybrodt, W., 1992, Dissolution kinetics of natural calcite minerals in CO2-water systems approaching calcite equilibrium: Chemical Geology, v. 100, p. 129– 145.
Swart, P.K., Cantrell, D.L., Arienzo, M.M., and Murray, S.T., 2016, Evidence for high temperature and 18O-enriched fluids in the Arab-D of the Ghawar field, Saudi Arabia: Sedimentology, v. 63, p. 1– 14.
Tavakoli, V., and Jamalian, A., 2018, Microporosity evolution in Iranian reservoirs, Dalan and Dariyan formations, the central Persian Gulf: Journal of Natural Gas Science and Engineering, v. 52, p. 155– 165.
Valencia, F.L., and Laya, J.C., 2020, Deep-burial dissolution in an Oligocene–Miocene giant carbonate reservoir (Perla Limestone), Gulf of Venezuela Basin: implications on microporosity development: Marine and Petroleum Geology, v. 113, p. 104144.
Walter, L.M., and Hanor, J.S., 1979, Orthophosphate: effect on the relative stability of aragonite and magnesian calcite during early diagenesis: Journal of Sedimentary Petrology, v. 49, p. 937– 944.
Walter, L.M., and Morse, J.W., 1984, Reactive surface area of skeletal carbonates during dissolution: effect of grain size: Journal of Sedimentary Petrology, v. 54, p. 1081– 1090.
Walter, L.M., and Morse, J.W., 1985, The dissolution kinetics of shallow marine carbonates in seawater: a laboratory study: Geochimica et Cosmochimica Acta, v. 49, p. 1503– 1513.
Xu, M., and Higgins, S.R., 2011, Effects of magnesium ions on near-equilibrium calcite dissolution: step kinetics and morphology: Geochimica et Cosmochimica Acta, v. 75, p. 719– 733.
Acknowledgments and Associated Footnotes
MH dedicates this paper to the memory of Dr. John W. Morse, who made invaluable contributions to the field of carbonate geochemistry among which is the development of the pH-stat technique used in this study. This study was supported by a grant from the U.S. National Science Foundation awarded to SEK (EAR-SGP-1828880). Additional financial support was provided by an SEPM Foundation research grant, and WMU graduate college research grant awarded to MH. We acknowledge the generosity of Dr. David Budd for providing the natural limestone samples used in this study. Abby Vanderberg at MSU is thanked for her help with SEM imaging. We are thankful to the two anonymous reviewers for their comments and suggestions.
1 Mohammed S. Hashim: Department of Geological and Environmental Sciences, Western Michigan University, 1903 West Michigan Avenue, Kalamazoo, Michigan 49008, U.S.A.; e-mail: [email protected]
2 Stephen E. Kaczmarek: Department of Geological and Environmental Sciences, Western Michigan University, 1903 West Michigan Avenue, Kalamazoo, Michigan 49008, U.S.A.
Received 20 October 2020 ; accepted 24 December 2020.
© 2021, SEPM (Society for Sedimentary Geology) Open Access. This paper is published under the terms of the CC-BY 4.0 license.