The AAPG/Datapages Combined Publications Database
AAPG Bulletin
Figure
AAPG Bulletin; Year: 2015; Issue: May DOI: 10.1306/10231414089
Return to Full Text
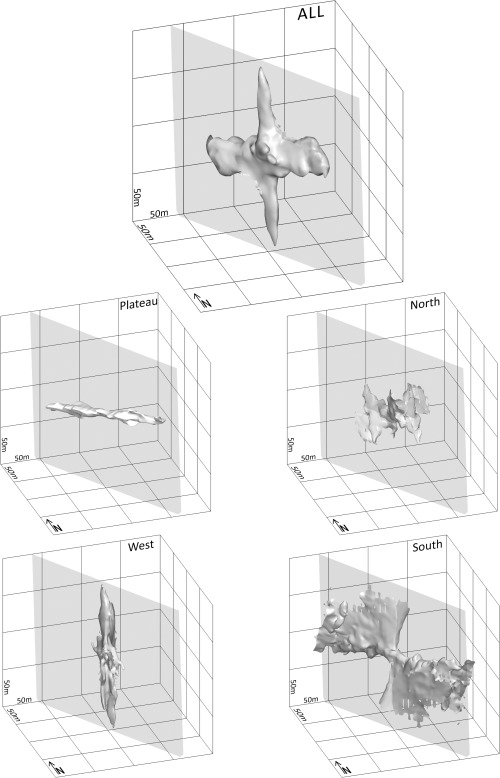
Figure 12
Three-dimensional contour surfaces at 0.09 of the variogram grids for the entire dataset and every zone separately. Orientation of all boxes is identical. The gray plane represents the best fit plane to the contour at 0.09 of all data. The subvertical and subhorizontal anisotropy is clearly visible for all data combined. For the separate zones, outcrop orientation has an important control on the contours. For example, the contour of the Plateau zone lacks the subvertical anisotropy. This can be explained by the fact that the topography of this zone is rather flat, and thus, very few vertically oriented point pairs are available. In every grid, it can be observed that anisotropy contours occur along the fitted plane.
Figure 12 Three-dimensional contour surfaces at 0.09 of the variogram grids for the entire dataset and every zone separately. Orientation of all boxes is identical. The gray plane represents the best fit plane to the contour at 0.09 of all data. The subvertical and subhorizontal anisotropy is clearly visible for all data combined. For the separate zones, outcrop orientation has an important control on the contours. For example, the contour of the Plateau zone lacks the subvertical anisotropy. This can be explained by the fact that the topography of this zone is rather flat, and thus, very few vertically oriented point pairs are available. In every grid, it can be observed that anisotropy contours occur along the fitted plane.