The AAPG/Datapages Combined Publications Database
AAPG Bulletin
Figure
AAPG Bulletin; Year: 2015; Issue: May DOI: 10.1306/10231414089
Return to Full Text
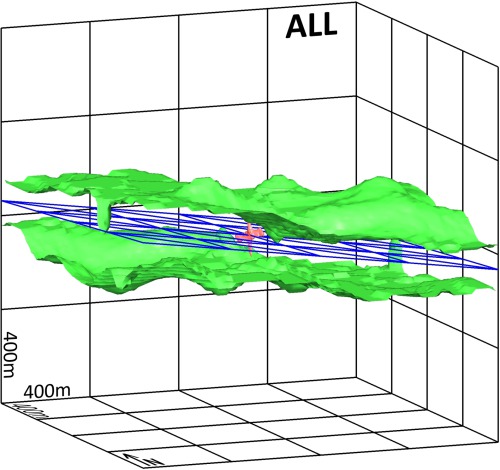
Figure 13
Contour surface (green) of a large-scale variogram grid at 0.18 semivariance. The best-fit plane to the contour surface is marked in blue and is slightly dipping to the northeast. The anisotropy orientation is equal to bedding. The small-scale anisotropy contour surface is added in red for comparison (center of the picture). A color version of this figure can be seen in the online version of this paper.
Figure 13 Contour surface (green) of a large-scale variogram grid at 0.18 semivariance. The best-fit plane to the contour surface is marked in blue and is slightly dipping to the northeast. The anisotropy orientation is equal to bedding. The small-scale anisotropy contour surface is added in red for comparison (center of the picture). A color version of this figure can be seen in the online version of this paper.