The AAPG/Datapages Combined Publications Database
AAPG Bulletin
Figure
AAPG Bulletin; Year: 2015; Issue: May DOI: 10.1306/10231414089
Return to Full Text

Figure 7
Variogram grid of the complete lithology point cloud with a resolution of 5 m. Analogous to variogram maps, the center of the grid represents the starting point of all semivariograms. The semivariogram in a specific direction is then represented by a line crosscutting the variogram grid that starts in the center and follows this specific direction.

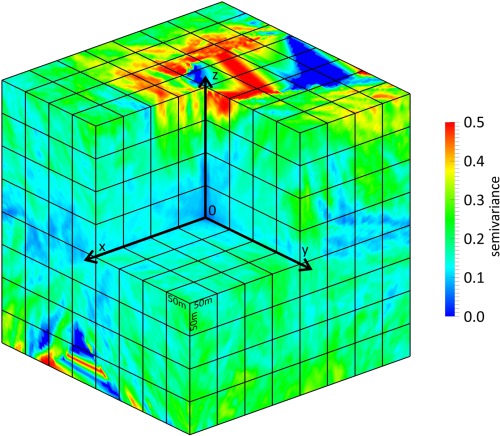
Figure 7 Variogram grid of the complete lithology point cloud with a resolution of 5 m. Analogous to variogram maps, the center of the grid represents the starting point of all semivariograms. The semivariogram in a specific direction is then represented by a line crosscutting the variogram grid that starts in the center and follows this specific direction.