The AAPG/Datapages Combined Publications Database
AAPG Bulletin
Figure
AAPG Bulletin; Year: 2016; Issue: April DOI: 10.1306/10191515063
Return to Full Text
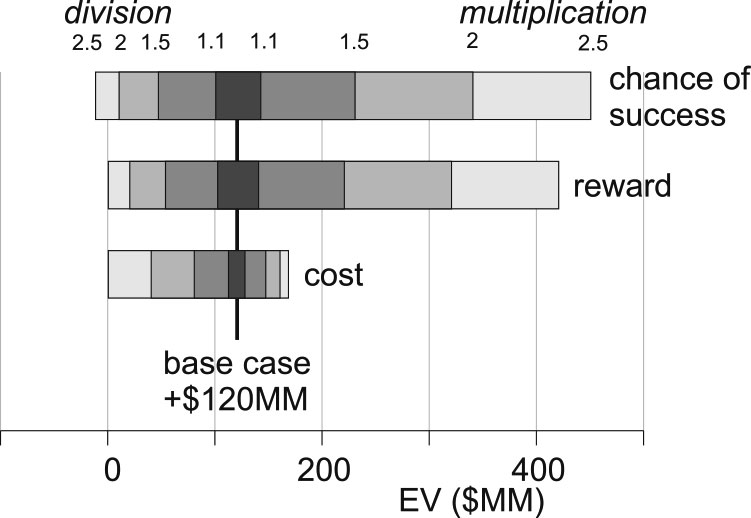
Figure 1. Tornado plot showing the change in the expected value (EV) of an opportunity from factors of division/multiplication, with a base case EV of +$120 million (MM) and base case values of cost of failure = $100 million, reward of success = $1000 million, and chance of success = 0.2. Tornado bars show the effects of multiplying (or dividing) the base case values by factors of 1.1, 1.5, 2, and 2.5.
Figure 1. Tornado plot showing the change in the expected value (EV) of an opportunity from factors of division/multiplication, with a base case EV of +$120 million (MM) and base case values of cost of failure = $100 million, reward of success = $1000 million, and chance of success = 0.2. Tornado bars show the effects of multiplying (or dividing) the base case values by factors of 1.1, 1.5, 2, and 2.5.