The AAPG/Datapages Combined Publications Database
AAPG Bulletin
Full Text
![]() Click to view page images in PDF format.
Click to view page images in PDF format.
AAPG Bulletin, V.
DOI: 10.1306/10191515063
Prospect risk, pot odds, and efficient drill or no-drill decision making: What the exploration business can learn from high-stakes poker
Frank J. Peel1
1National Oceanography Centre, University of Southampton, Waterfront Campus, Southampton, United Kingdom; [email protected]
ABSTRACT
A decision to proceed with risk ventures, such as exploration wells, requires three basic estimates: the cost, if the venture fails; the reward, if the venture succeeds; and the chance of success (risk). These three estimates are combined to derive the expected value and expected rate of return, which are critical to decisions to proceed or not to proceed with the risk venture. However, although cost and reward are seen as relatively “hard” numbers, based on measurable quantities and established price forecasts, risk is commonly seen as a “soft” number, an opinion based on incomplete knowledge. Decisions may be deferred, seeking more constraint on the risk estimate; this delay can be counterproductive. An alternative approach is used by professional poker players to make an equivalent decision. In that business, too, the chance of winning is harder to constrain than the cost and reward. Instead of seeking to fine-tune the risk, players compare a rough estimate of chance with “pot odds,” an easily calculated number (the chance of winning needed to break even), and use this comparison to make the right decision efficiently.
This approach can also be used in the exploration business. Pot odds of a prospect can be calculated using expected dry hole costs and the predicted value of a discovery. Comparison with the estimated chance of success may indicate whether we already have enough information to make the appropriate decision or whether further work is justified. This may improve business decision-making efficiency or provide a sense check on decisions already made.
INTRODUCTION
The fundamental principles of decision making in the petroleum industry are well established (e.g., Matheson and Howard, 1968; Bickel and Bratvold, 2008; Bratvold and Begg, 2010; Begg et al., 2014).
Three conditions test whether the decision to drill a prospect is appropriate:
1. Rationality: the decision is based on rational analysis of all the available information; others would make the same decision given the same data.
2. Value: the expected value of the opportunity is sufficiently positive.
3. No regrets: it is not likely that we would make a different decision based on new information that could be acquired prior to drilling.
This paper describes a method that may improve the efficiency of the value test by directing the focus of activity away from refining the estimates of the chance of success and expected value and toward a consideration of a threshold risk value for the opportunity (analogous to the “pot odds” concept used in card games). The method of Peel and Brooks (2015) is developed to make a rational estimate of the chance of regret.
These approaches may make decision making more efficient. In some cases, they could identify where there is already sufficient information to proceed without investing further expense, time, and effort in the refinement of predrill analyses.
The business of petroleum exploration, like the business of professional poker, is a game of risk played for high stakes. Rose (2001) and others have noted that if the expected commercial value (EV) of an at-risk exploration opportunity is positive, participation in that opportunity is an investment, not a gamble. We expect to come out ahead if we make many similar choices. Samuelson (1963) showed that it makes sense to participate in a single at-risk opportunity if the EV is suitable, even if it is not part of the suite of opportunities. Companies that make money over the long term do so because they have fit-for-purpose estimates of risk, reward, and cost, coupled with the ability to make the right decisions in a timely manner. Fit for purpose, in this context, means that the estimates of risk, reward, and cost are sufficiently robust to form the basis of a valid decision; further effort might improve their precision or their accuracy, but that refinement is unlikely to invalidate or change the decision.
All relevant terms and abbreviations used here are defined in the Appendix. Terminology is consistent with companion articles (Peel and Brooks, 2015, 2016; Peel and White, 2015). As in those articles, to avoid potential confusion, the term “chance of success” and the abbreviation Pg are used to signify the quantitative estimate of the chance of geological success of a prospect (see the Appendix for clarification), whereas the word “risk” is used in an informal, qualitative sense.
The basic equation for EV, from Rose (2001), is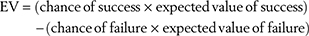
If we take the chance of geological success (Pg) as our success criterion, this can be written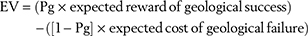
Two different classes of exploration opportunity can be considered (see Table 1 for examples of each):
Type 1: the terms are not fixed. The cost of failure, the reward of success, or both can be selected. The decision is in two parts (choosing to participate and selecting a bid level). A commonly encountered type 1 decision is an opportunity to farm in to the drilling of a prospect, awarded to the company bidding the highest promote level (see the Appendix). For a type 1 decision, the optimum bid level is based on estimates of cost, reward, and chance of success. Reduction in EV is balanced against an increase in the chance of winning the bid (see, for example, Johnston, 2003). For this class of decision, there is value in fine-tuning the estimated chance of success. Although type 1 decisions are important, the pot odds concept is not readily applied to them, so they are not the focus of this article.
Type 2: the terms are fixed. The decision is solely whether to participate or not, because no part of the expected value is negotiable. A commonly encountered type 2 decision is whether to drill a prospect that is already licensed.
Current estimates of cost, reward, and chance of success are used to calculate the EV of the opportunity. A decision to proceed can be made on the basis that EV is positive, with a sufficient expected rate of return. Value is added by making the appropriate choice, but once there is sufficient information available to make that determination, little value is added by further refining the estimated chance of success.
However, the estimate of the chance of success is seen as a “soft” number, an opinion based on incomplete data (Binns and Corbett, 2012), subject to cognitive bias (Baddeley et al., 2004). Furthermore, in most cases, chance of success is the factor to which EV is most sensitive. As a result, exploration companies may expend undue time and effort refining the estimate of chance of success beyond the point at which an appropriate decision could be made.
It is instructive to compare type 2 decision making in petroleum exploration with similar decisions made in card games, in which the player’s choice is based on the reward of winning (a known quantity), the cost of playing (also known), and an estimate of the chance of success (commonly uncertain and difficult to calculate). Duke and Diamond (2005) describe an efficient strategy used by some professional poker players. Instead of focusing on the EV of the opportunity, which requires an exact estimation of the chance of success, they calculate what the chance of success would have to be to break even (the pot odds). They compare this with a rough estimate of the actual chance of winning, obtained from past experience and simple rules of thumb. To make the right decision, it is necessary to know only whether the actual chance of success is greater than the pot odds. For this purpose, an imprecise estimate of the chance of success may suffice. The pot odds method enables an appropriate decision to be made in a short time, without unnecessary refinement of the estimates.
This paper explores ways in which a similar approach might be used in petroleum exploration, with potential improvement in decision-making efficiency and confidence.
HARD VERSUS SOFT NUMBERS
The cost and reward parts of the EV equation are perceived as comparatively “hard” numbers, based on subsurface geophysical mapping, engineering designs, historical well costs, rig rates, and other quantitative measures. In contrast, the chance of success estimate may be seen as a comparatively soft number, because it is an opinion, not a measurable quantity. It is based on incomplete, imperfect data and subject to cognitive bias (e.g., Baddeley et al., 2004). Begg et al. (2014) noted that both the definition of prospect risk and its assigned probability, Pg, are personal, and they classify it as a state of mind as opposed to a state of things. Therefore, Pg is a subjective probability (e.g., Kahneman and Tversky, 1972; Binns and Corbett, 2012), not an objective quantity.
This perception is compounded by the knowledge that, for cost and reward, there is an actual right answer that will become known if the well is drilled. The actual cost of drilling will be spent, and the value of the discovery will become known in the event of success. In contrast, there is no demonstrable right answer for the chance of success, which is an opinion based on the current understanding. With perfect and complete knowledge, it would have a value of 1 or 0. It has an intermediate value only because that information is not known. The results of drilling do not reveal what the appropriate predrill estimate of Pg should have been. Instead, they reveal what the subsurface reality is.
It is, therefore, natural that decision makers may feel uncomfortable investing in an exploration well (which may cost hundreds of millions of dollars) based on a soft number, the estimate of chance of success. In consequence, they may seek further clarification and refinement of that estimate before making the decision. But making the choice to defer a final decision can effectively be an unintentional choice not to drill, an example of “paralysis by analysis” (Langley, 1995), because many opportunities have limited lifespans, governed by factors such as lease expiry.
SENSITIVITY OF EXPECTED COMMERCIAL VALUE TO RISK, REWARD, AND COST: WHY RISK CAN BE THE DOMINANT FACTOR
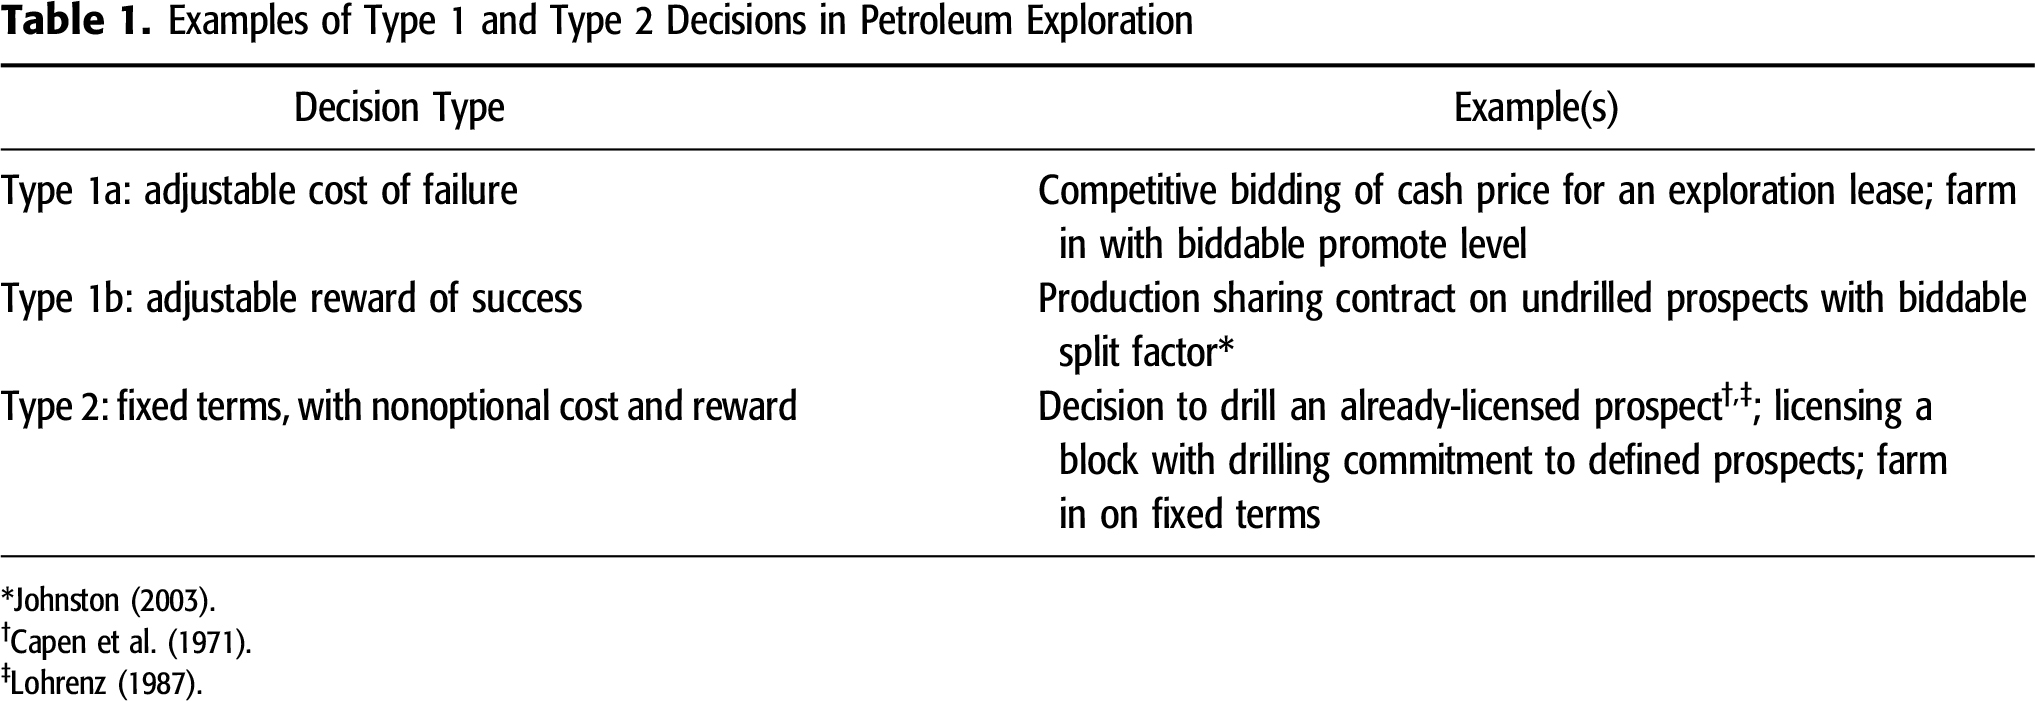
The EV depends on three variables (the chance of success, the expected cost of failure, and the expected reward of success), but it is typically more sensitive to variation in the chance of success than it is to variation in cost and reward (Figure 1). This suggests that at least as much attention should be paid to estimating the chance of success as is put into estimating the expected cost and reward.
 Figure 1. Tornado plot showing the change in the expected value (EV) of an opportunity from factors of division/multiplication, with a base case EV of +$120 million (MM) and base case values of cost of failure = $100 million, reward of success = $1000 million, and chance of success = 0.2. Tornado bars show the effects of multiplying (or dividing) the base case values by factors of 1.1, 1.5, 2, and 2.5.
Although the tornado plot shown in Figure 1 is a useful comparison of the effect of the same error margins applied to cost, reward, and chance of success, this does not imply that the error margins for the three variables are equivalent.
Error Margin of Cost of Failure
Probabilistic forward models of well costs (e.g., Akins et al., 2005; Hariharan et al., 2006; Kullawan, 2012) tend to indicate well cost error ranges of ±20%–40%. The author’s experience indicates that the error range should be somewhat greater, but the data to constrain this are not publicly available.
Error Margin of Reward of Success
Typical error ranges on estimates of the value of success are wider. Pn is the value for which we consider there to be n% chance of a success case outcome exceeding, so that there is a 90% chance that the success case outcome exceeds the P90 value, and a 10% chance that the success case outcome exceeds the P10 value; the P90 to P10 range is a measure of the error range for the success case value. Binns and Corbett (2012), combining probabilistic predrill volume estimates for 30 prospects, show a distribution for which the P10 is approximately four times the P90, indicating that the error margin is a factor of 2.
The error margin of the risk estimate is a difficult concept to define, and it is still more difficult to quantify. A possible definition is that the error represents the possible difference between what Pg is currently estimated to be and what it might be in the future after all reasonable predrill technical work has been completed.
The future Pg estimate may be increased, be decreased, or remain the same, but the mean of all these possible future states is equivalent to the prior estimate (Peel and Brooks, 2015; Peel and White, 2015).
The method set out in this paper to a specific prospect requires an estimate of the error margin of Pg for that prospect. This can be estimated by considering the maximum reasonable positive or negative impact on Pg that could result from all the new data that will be acquired and all the technical analysis that may be completed prior to drilling.
The author has personal experience risking hundreds of prospects in an exploration portfolio, with many of these being reviewed and rerisked several times as technical work continued and new data were acquired. This experience indicates that a prospect with a prior Pg of 0.25 might, typically, move down to 0.2 or up to 0.3, but larger moves are less common, indicating that the typical error margin is a factor of ±20%. The error margin may also be judged by comparing the current estimates obtained by different people, different teams, or different companies. Typically these fall within the same range, but on rare occasions much higher differences between companies have been known (E. Cazier, 2015, personal communication). Alternatively, if the Pg estimate was obtained by aggregation (Surowiecki, 2004), with peer review leading to a voting process, the range of individual votes might be used as a simple means of estimating the error range of Pg.
THE CONCEPT OF POT ODDS AND ITS APPLICATION TO DECISION MAKING IN PETROLEUM EXPLORATION
Many methods can be used to estimate Pg (e.g., Megill, 1977; Rose, 1987, 1992, 2001; White, 1993; Duff and Hall, 1996; Peel and Brooks, 2016), and it is not the purpose of this paper to discuss these methods. However, fine-tuning an existing estimate of Pg may not be a useful contribution to the decision-making process, and it may even be a distraction from the real business at hand, which is to make a decision to drill or not to drill. While a group of geoscientists may be able to argue at length as to whether the precise estimate of the Pg of a prospect should be 0.25 or 0.30, the same group should be able to reach a rapid consensus that Pg is significantly better than 0.15, and this call may be sufficient to make the key decision. Instead of fine-tuning an estimate of the actual chance of success, it may be simpler to calculate what Pg would have to be to achieve a break-even EV, or it may be simpler to achieve a desired rate of return and then judge whether the Pg of the prospect in question exceeds this value.
As noted by Rose (2001), there are parallels between exploration well decisions and games of risk such as poker. In both cases, we have an estimate of the potential reward (the mean success case value or the size of the pot), an estimate of the cost of playing (the dry hole cost or the size of the required bet), and the experience that allows us to estimate the chance of success. It is easy to see the size of the prize and the cost of failure, but it is difficult to calculate the estimated chance of winning.
Although it may be difficult to calculate the chance of success of a hand of cards, Duke and Diamond (2005) show that an approximate estimate may suffice. It is more important, and much more straightforward, to calculate the odds that would be necessary to break even, given the known size of the pot and the known cost of playing. This critical threshold level, known as pot odds, is readily calculated as c / (r + c), where c is the net go-forward cost of failing, and r is the net go-forward reward of winning. If the current rough estimate of the chance of success is clearly better than the pot odds, the player can make a simple and effective decision to proceed (or vice versa) and have good confidence that the decision is appropriate.
The correct decision can be made rapidly without having to fine-tune an estimate of the chance of winning.
The same approach can be readily applied to petroleum exploration. We can easily calculate Pgpot, the pot odds of an exploration opportunity. Just as in the poker game, these are the odds that would allow us to break even (i.e., the Pg that would give EV = 0).
where c = dry hole cost, and r = reward of success case.
In business, it is not sufficient just to break even. A good exploration opportunity should give an expected rate of return that justifies participation. The odds required to deliver a desired minimum rate of return (RoR) are
For the example used in Figure 1, the base case values are c = $100 million and r = $1000 million, giving pot odds = Pgpot = 0.09. To achieve a minimum rate of return of 25%, the threshold Pg is 0.11.
It is very straightforward to estimate the pot odds and the odds needed to achieve a desired rate of return for drilling a prospect. This process provides, at the very least, a useful sense check. It may enable us to streamline the decision-making process, by changing it from one of iteration to precision (Matheson and Howard, 1968; Bickel and Bratvold, 2008), as shown in Figure 2A, to a very much abbreviated, and potentially more efficient, process shown in Figure 2B.
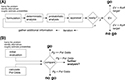 Figure 2. (A) Standard decision analysis cycle (after Matheson and Howard, 1968; Bickel and Bratvold, 2008). (B) Pot odds approach, which may enable more efficient decision making. EV = expected commercial value; n = no; Pg = chance of geological success; RoR = rate of return; y = yes.
This is illustrated by a notional prospect for which there are good estimates of $100 million for the mean dry hole cost and +$250 million for the mean success case value and an initial estimate of Pg = 0.4 for the chance of success. Using these numbers, the EV of the opportunity has a positive value (+$40 million), indicating that the right decision is probably to drill.
However, EV calculation alone does not give a sense of how robust such a decision to drill would be. The decision might be deferred so that more time and effort could be spent refining the estimated chance of success, following the loop shown in Figure 2A.
A complementary approach, which casts light on whether seeking further risk refinement is worthwhile, is to calculate the pot odds for this opportunity. Given the same numbers for cost and reward, it is readily determined that the opportunity would break even with Pgpot = 100/(100 + 250) = 0.286 and that the Pg required to give an expected rate of return of 25% is (100 + 25)/(100 + 250) = 0.36. Calculating these values should be a trivial matter requiring no extra work, because the dry hole cost and the reward of success should already have been estimated as part of the conventional decision process.
For this example, the team considers that a reasonable predrill work program could change the estimate of Pg up to 0.45 or down to 0.35, so the likely error range of Pg is ±0.05.
A simple comparison of this error range with the pot odds (Figure 3) demonstrates that the prospect is quite robust as currently evaluated. It has a positive expected value, and new work or new data are unlikely to change that status. It is likely to give an expected rate of return above 25%.
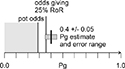 Figure 3. Comparison of the chance of geological success (Pg) estimate against the pot odds and the odds required to give 25% rate of return (RoR).
In this case, we could make a decision to proceed with some confidence and with no requirement for further work. This does not mean that work should necessarily be halted; there is always some transferrable value to be gained from any new learning, but in a resource-constrained organization it may be more efficient to redirect effort to other opportunities where it can add more value.
The power of this approach in differentiating between opportunities is illustrated by Figure 4, where three different prospects are shown to have different values for the reward of the success case, the cost of the failure case, and the chance of success. Each prospect has the same EV (+$40 million), and each prospect has the same pot odds (0.167). Each prospect also has the same margin of error for the Pg estimate (±0.05). The conventional EV approach alone provides no discrimination between the three prospects. However, it is clear by observation that for prospect c, the error bar of Pg does not come close to the pot odds threshold, and therefore a decision to proceed can be made without refining the Pg estimate. For the other two prospects (a and b), there is significant incursion of the error bar into the negative territory below pot odds, so for these, we may either choose to initiate further study before making the decision or to redirect efforts to more promising opportunities.
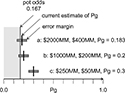 Figure 4. Comparison of the chance of geological success (Pg) estimate against the pot odds for three prospects (a, b, and c), which all have the same expected commercial value. The values shown are, in order, the mean reward of success, mean cost of failure, and current estimate of Pg. MM = million.
CALCULATING THE CHANCE OF REGRET
The third condition for a good decision is that we are not likely to regret making a commitment to a well test based on new information that we might acquire prior to the test. In some circumstances, it is possible to estimate the chance of regret, which could further inform the decision.
This may be possible if
• the nature (but not the outcome) of the new information is known;
• the outcome is binary: either good news (leading us to upgrade the estimated chance of success) or bad news (leading us to downgrade it), with no intermediate outcomes; or
• the revised value of Pg can be predicted for either outcome.
As shown graphically in Figure 5A, the current estimate of Pg (prior value, P1) may be downgraded to P2 by bad news or upgraded to P3 by good news. If we can estimate these future conditional probabilities, P2 and P3, then we can calculate the likelihood of a bad news outcome (x) that is compatible with them using the law of total probability (see discussion in Peel and White, 2015; Peel and Brooks, 2015), as follows: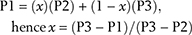
Figure 5B shows a worked example in which a prospect has a currently estimated Pg of 0.3, positive EV, and pot odds of 0.2. A drill or drop decision must be made immediately to retain the license. Given these positive indications, a decision to test the prospect has been made. However, the quality of the hydrocarbon fluid is unknown, and this could be resolved by obtaining a fluid sample from a nearby well. If the fluid in the adjacent structure is found to be highly biodegraded, Pg for the prospect would reduce to 0.15. In that outcome, the new Pg would have fallen below the pot odds threshold, and we would regret the decision to commit to drilling. Conversely, if the fluid is revealed to be of good quality, Pg would be raised to 0.35. Applying the law of total probability indicates that the chance of the bad outcome, which will cause us to regret the decision prior to testing, is approximately 0.25. It is unlikely that the new information would cause us to regret a go-ahead decision, and this knowledge may help to inform the decision-making process.
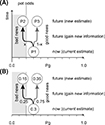 Figure 5. Estimation of the chance of regret based on an estimate of prior (current) chance of success and estimates of what that could change to in light of bad news or good news. The x-axis represents the estimated chance of geological success (Pg); the y-axis shows the passage of time and the acquisition of new information. A decision and commitment to proceed has been made on the basis that the current Pg estimate exceeds the pot odds threshold. If the new information brings good news, the Pg estimate increases, and vice versa. We will regret the decision only if the revised Pg estimate falls below the pot odds threshold (gray shading). (A) The general case: P1 represents our current (prior) estimate of the chance of success, Pg, prior to gaining new information. P2 and P3 represent the possible future values of the Pg estimate, given that new information is bad news (P2) or good news (P3); x is the chance of bad news, and (1 − x) is the chance of good news. (B) Values used in the worked example described in the text.
The chance of regret estimated in this way is a correct calculation, but it is highly subjective, because it is obtained by combining three different subjective probability estimates. Consequently, it should be used as an indicative guide, not a rule.
Estimating the chance of regret is impractical if
• the new information is not binary, so that instead of a single good news or bad news outcome, it could provide a distribution of possible intermediate outcomes; or
• the impact that the new information could have on the chance of success cannot be predicted.
CONCLUSIONS
For some decisions, value can be added by refining the estimate of the Pg. These are the situations where we not only need to decide whether to participate, but also to set a bid level that affects the cost and reward. However, a common class of decisions, such as the choice to drill a prospect, only requires us to make the right choice. Refining the Pg estimate adds no further value once there is enough information to make that call.
An estimate of the EV of the opportunity is commonly made as part of the conventional decision-making process. The EV calculation requires an estimate of the cost of failure and the reward of success. Two critical parameters are readily calculated from the same inputs: pot odds (the Pg that would give an EV of 0) and RoR threshold odds (the Pg that gives a desired RoR for the ventured cost).
A simple comparison of the currently estimated Pg against the pot odds and against the RoR threshold odds may be sufficient to make the decision to drill or not to drill. If the reasonable error range of Pg is above the critical threshold limit, it adds no value to further refine the Pg estimate. It is more important to estimate what the potential error of the Pg estimate might be than it is to refine the estimate.
Application of this approach requires little additional work. At the very least, it should be of value in informing the decision-making process. In some circumstances, it may enable significant cost and time savings in the exploration cycle by helping to identify when there is already enough information available to make the appropriate decision.
APPENDIX: DEFINITIONS
Farm in: a business deal in which a company earns equity in an exploration opportunity, typically in return for a cash payment and/or taking on a share of the cost, commonly at a premium (promote level).
Promote level: the ratio between the fractional equity earned and the fraction of the costs to be paid, so that earning 50% equity in exchange for paying 100% costs constitutes a two-for-one promote.
Geological success of a prospect: the following discussion is modified from Peel and Brooks (2015). The chance of prospect success is critical to the understanding of prospect economics (e.g., Allais, 1956; Newendorp, 1972; Megill, 1977; Rose, 1987, 2001). However, literature is inconsistent as to how it should be defined. This definition set out here, which is widely applied in exploration companies, is consistent with (and necessary for) modern methods of prospect volume estimation using probabilistic tools such as GeoX®.
Every exploration prospect, before it is drilled, should have a clearly defined geological success case model describing all its components (for example, the success model for a prospect could be that it is a four-way closure containing deepwater turbidite sands deposited in a slope channel, sealed by a marine shale, and sourced by a defined source rock, etc.). The geological success case model is a sufficient condition for the presence of a hydrocarbon accumulation. If all the components of the geological success case model are true, then the conditions for hydrocarbon accumulation have been met and an accumulation exists.
The parameter ranges (e.g., reservoir porosity, closure height, volume of migrated hydrocarbons, etc.) that the success case geology could deliver are defined, and these are used to calculate the range of possible hydrocarbon volumes that the prospect success case model as a whole could deliver. These success case volumes can be described by probability density and exceedance curves (Figure 6).
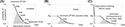 Figure 6. (A) Unrisked exceedance curve (black) and probability density function (gray) showing the range of volumes predicted if the success case model is correct. In the event of geological success, the model is correct. The minimum volume in the success case is the P100; there is an n% chance that the volume will exceed the Pn value. (B) Risked curves, showing the absolute chance of exceeding the same volumes. (C) Risked curves for a prospect for which some of the geological failure cases may contain hydrocarbons. Pg = chance of geological success.
The outcome is deemed to be a geological success if the success case geological model, as defined prior to drilling, is a true description of the subsurface reality. The consequence of success by this definition is that the discovered volume falls on the defined success case probability versus volume curve. There is an n% chance that the success case volume will exceed the Pn value (e.g., there is a 50% chance, given success, that the volume exceeds the P50). The minimum success case volume may be, but is not necessarily, zero. Figure 6 shows an example where the success case probability–volume curve does not start at zero.
Success does not necessarily equate to there being enough reservoired oil or gas to sustain flow (cf., Rose, 2001) nor to the outcome being commercially developable (although success may fulfill these conditions).
Exceedance probability and P90-P50-P10 values: many events give an outcome of unknown magnitude, such as a discovery well proving the existence of a hydrocarbon accumulation whose size is unknown in advance. It is common (e.g., Rose, 1987, 2001) to describe the distribution of such future outcomes using exceedance probability curves, which plot an outcome value Pn (e.g., the volume of the discovered field) against the probability n% that the outcome will be larger than that value, as shown in Figure 6. Thus, P100 represents a value we are 100% certain the outcome will exceed (i.e., it is the minimum volume); P90 represents a value we think there is a 90% chance the outcome will exceed; P50 is value we think there is a 50% chance the outcome will exceed; and so on up to P0, the maximum value that we think there is zero chance of the outcome exceeding.
Geological failure of a prospect: the outcome is deemed to be a geological failure if all or any component part of the conditions required for the geological success case model are not true. Some geological failure cases may contain in-place hydrocarbon volumes (Figure 6C), for example, if instead of the reservoir model (sandstone) defined as constituting the success case, the structure contains a different rock with some porosity (e.g., siltstone, tuff). Some geological failure outcomes may even have enough reservoired oil or gas to sustain flow.
Chance of geological success: prospect Pg is the current estimate of the likelihood that the success case geological model is correct, based on the current available data and state of understanding.
The Pg is equivalent to the chance of being on the success case curve of the probability–volume distributions. Because the statement of the geological success case model should be intimately linked to the expression of the parameter ranges that the success case should deliver, the chance of success is explicitly equivalent to the chance of exceeding the P100 success case hydrocarbon volume; it is also equivalent to twice the chance of exceeding the P50 success case volume, 10 times the chance of exceeding the P10, and so on, as shown in Figure 6B.
The Pg is therefore not equivalent to the chance that the prospect is commercially developable, that the structure contains hydrocarbons, or that the hydrocarbons constitute at least a “moveable teacup” (minimum reservoired oil or gas to sustain flow).
The use of the abbreviation Pg follows the terminology of Rose (1987, 1992, 2001); other sources use different abbreviations, including GP (geological probability), GPoS (geological probability of success), CoS (chance of success), and POSg (Ross, 1997, 2004; Quirk and Ruthrauff, 2008).
The term “risk” is also used in some sources to describe the chance of success (Rose, 1992, 2001; White, 1993), with potential confusion as to whether it means the chance of the desirable outcome (Pg) or the chance of the undesirable outcome (1 − Pg), and with further confusion with the use of the same word to mean a different concept in financial literature (see discussion in Peel and Brooks, 2015). Therefore, in this article, the word risk is used in only a qualitative sense.
Expected value: the mathematical use of “value” means the magnitude of any quantity (number, mass, distance, etc.), not necessarily a monetary quantity. In statistics and probability analysis, the expected value of a discrete random variable is the probability-weighted average of all possible values. This quantity is calculated by multiplying each of the possible outcomes by the likelihood that each outcome will occur and summing all of those values. In this article we use “expected” and “expected value” to refer to statistical expectation.
Expected commercial value: the meaning is slightly different in finance and economics, where the word “value” refers specifically to the commercial worth. Expected commercial value (ECV) is the statistical expected value of the commercial worth of a project or opportunity. In petroleum economics literature, expected commercial value is commonly abbreviated to expected value or EV (e.g., Rose, 2001). Because this leads to potential ambiguity, in this article we specifically state “EV” when referring to expected commercial value.
where Ai represents a possible outcome of the project (there are n possible outcomes, A1 to An); P(Ai) is the probability of a particular outcome (Ai); and V|Ai is the monetary value of the same particular outcome (Ai).
If all the outcomes considered successes are amalgamated based on some defined criterion, estimations can be made for the chance of success,  ; for all the m success cases; the chance of failure; the expected value of success (i.e., the reward); and the expected value of failure (i.e., the cost).
Given this simplification, the relationship of Rose (2001, p. 1) is obtained:
This relationship applies no matter what criterion is chosen to define success, as long as the value estimate is consistent with that criterion. If the criterion is defined as geological success, then
Present value: the value of money held in the future is different from the value of the same dollar amount held today. Adjusting the values of future costs and rewards to account for the passage of time, using a discount rate, enables calculation of the equivalent value today (present value).
Expected net present value: the equivalent of EV if the monetary amounts involved are all converted to PV (ENPV). Hence, if cost and reward are expressed in present value terms,
REFERENCES CITED
Akins, W. M., M. P. Abell, and E. M. Diggins, 2005, Enhancing drilling risk and performance management through the use of probabilistic time and cost estimating: SPE/IADC Drilling Conference, Amsterdam, February 23–25, 2005, SPE-92340-MS, 9 p., doi:10.2118/92340-MS.
Allais, M., 1956, Évaluation des perspectives économiques de la recherche minière sur de grands espaces: Application au Sahara Algérien: Revue de l'Industrie Minérale, p. 329–383.
Baddeley, M. C., A. Curtis, and R. Wood, 2004, An introduction to prior information derived from probabilistic judgements: Elicitation of knowledge, cognitive bias and herding, in Curtis, A., and R. Wood, eds., Geological prior information: Informing science and engineering: Geological Society, London, Special Publications 2004, v. 239, p. 15–27, doi:10.1144/GSL.SP.2004.239.01.02.
Begg, S. H., R. B. Bratvold, and M. B. Welsh, 2014, Uncertainty vs. variability: What’s the difference and why is it important?: SPE Hydrocarbon Economics and Evaluation Symposium, Houston, Texas, May 19–20, 2014, SPE-169850-MS, 21 p., doi:10.2118/169850-MS.
Bickel, J. E., and R. B. Bratvold, 2008, From uncertainty quantification to decision making in the oil and gas industry: Energy Exploration and Exploitation, v. 26, no. 5, p. 311–325, doi:10.1260/014459808787945344.
Binns, P., and P. Corbett, 2012, Risk and uncertainty from frontier to production – A review: First Break, v. 30, p. 41–48, doi:10.3997/1365-2397.2012006.
Bratvold, R. B., and S. H. Begg, 2010, Making good decisions: Dallas, Texas, Society of Petroleum Engineers, 207 p.
Capen, E. C., R. V. Clapp, and W. M. Campbell, 1971, Competitive bidding in high risk situations: Journal of Petroleum Technology, v. 23, no. 6, p. 641–653, SPE-2993-PA, doi:10.2118/2993-PA.
Duff, B. A., and D. Hall, 1996, A model-based approach to evaluation of exploration opportunities, in Dore, A. G., and R. Sinding-Larsen, eds., Quantification and prediction of petroleum resources: Norwegian Petroleum Society Special Publication 6, p. 183–198, doi:10.1016/S0928-8937(07)80018-X.
Duke, A., and D. Diamond, 2005, Annie Duke: How I raised, folded, bluffed, flirted, cursed, and won millions at the World Series of Poker: New York, Hudson Street Press, 272 p.
Hariharan, P. R., R. A. Judge, and D. M. Nguyen, 2006, The use of probabilistic analysis for estimation of drilling time and costs when evaluating economic benefits of new technologies: IADC/SPE Drilling Conference, Miami, Florida, February 21–23, 2006, SPE-98695-MS, 10 p., doi:10.2118/98695-MS.
Johnston, D., 2003, International exploration economics, risk, and contract analysis: Tulsa, Oklahoma, PennWell, 479 p.
Kahneman, D., and A. Tversky, 1972, Subjective probability, a judgment of representativeness: Cognitive Psychology, v. 3, p. 430–454, doi:10.1016/0010-0285(72)90016-3.
Kullawan, K., 2012, Risk based cost and duration estimation of well operations, master’s thesis, University of Stavanger, Stavanger, Norway, 113 p.
Langley, A., 1995, Between “paralysis by analysis” and “extinction by instinct”: Sloan Management Review, v. 36, no. 3, p. 63–76.
Lohrenz, J., 1987, Bidding optimum bonus for federal offshore oil and gas leases: Journal of Petroleum Technology, v. 39, no. 9, p. 1102–1112, SPE-15992-PA, doi:10.2118/15992-PA
Matheson, J. E., and R. A. Howard, 1968, An introduction to decision analysis, in Howard, R. A., and J. E. Matheson, eds., The principles and applications of decision analysis: Menlo Park, California, Strategic Decisions Group, p. 17–55.
Megill, R. E., 1977, An introduction to exploration risk analysis: Tulsa, Oklahoma, PennWell, 273 p.
Newendorp, P. D., 1972, Bayesian analysis–A method for updating risk estimates: Journal of Petroleum Technology, v. 24, p. 193–198, SPE-3463-PA, doi:10.2118/3463-PA.
Peel, F. J., and J. R. V. Brooks, 2015, What to expect when you’re prospecting: How new information changes our estimate of the chance of success of a prospect: AAPG Bulletin, v. 99, no. 12, p. 2159–2171, doi:10.1306/07061515045.
Peel, F. J., and J. R. V. Brooks, 2016, A practical guide to the use of success versus failure statistics in the estimation of prospect risk: AAPG Bulletin, v. 100, no. 2, p. 137–150, doi:10.1306/08101515059.
Peel, F. J., and J. White, 2015, Do technical studies reduce subsurface risk in hydrocarbon exploration—And if not, how do they add value? in Hirst, P., and M. Bowman, eds., The value of outcrop studies in reducing subsurface uncertainty and risk in hydrocarbon exploration, development and production: Geological Society, London, Special Publications 2015, v. 436, doi:10.1144/SP436.4.
Quirk, D. G., and R. G. Ruthrauff, 2008, Toward consistency in petroleum exploration: A systematic way of constraining uncertainty in prospect volumetrics: AAPG Bulletin, v. 92, no. 10, p. 1263–1291, doi:10.1306/06040808064.
Rose, P. R., 1987, Dealing with risk and uncertainty in exploration: How can we improve?: AAPG Bulletin, v. 71, no. 1, p. 1–16.
Rose, P. R., 1992, Chance of success and its use in petroleum exploration, in Steinmetz, R., ed., The business of petroleum exploration: AAPG treatise of petroleum geology, Handbook of petroleum geology, p. 71–86.
Rose, P. R., 2001, Risk analysis and management of petroleum exploration ventures: AAPG Methods in Exploration 12, 178 p.
Ross, J. G., 1997, The philosophy of reserve estimation: SPE Hydrocarbon Economics and Evaluation Symposium, Dallas, Texas, March 16–18, 1997, SPE-37960-MS, 7 p., doi:10.2118/37960-MS.
Ross, J. G., 2004, Risk and uncertainty in portfolio characterisation: Journal of Petroleum Science and Engineering, v. 44, no. 1–2, p. 41–53, doi:10.1016/j.petrol.2004.02.004.
Samuelson, P. A., 1963, Risk and uncertainty, a fallacy of large numbers: Scientia, v. 98, p. 108–113.
Surowiecki, J., 2004, The wisdom of crowds: Why the many are smarter than the few and how collective wisdom shapes business, economies, societies, and nations: New York, Doubleday, 296 p.
White, D. A., 1993, Geologic risking guide for prospects and plays: AAPG Bulletin, v. 77, no. 12, p. 2048–2064.
AUTHORS
Frank Peel received his doctorate from the University of Oxford. He was a structural geologist and senior technical advisor at BP and BHP from 1985 to 2013. He joined the National Oceanography Centre in 2013. His research interests include salt tectonics, gravity-driven deformation, fluid flow, and exploration risk. He is a recipient of the AAPG Matson Award.
ACKNOWLEDGMENTS
The author gratefully acknowledges financial support for Frank Peel by NERC, the UK Natural Environment Research Council, through National Capability funding. Incisive reviews of an early draft by Ed Cazier and an anonymous reviewer greatly improved this article.