The AAPG/Datapages Combined Publications Database
AAPG Bulletin
Figure
AAPG Bulletin; Year: 2016; Issue: April DOI: 10.1306/10191515063
Return to Full Text
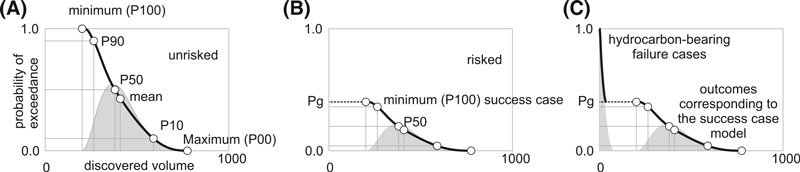
Figure 6. (A) Unrisked exceedance curve (black) and probability density function (gray) showing the range of volumes predicted if the success case model is correct. In the event of geological success, the model is correct. The minimum volume in the success case is the P100; there is an n% chance that the volume will exceed the Pn value. (B) Risked curves, showing the absolute chance of exceeding the same volumes. (C) Risked curves for a prospect for which some of the geological failure cases may contain hydrocarbons. Pg = chance of geological success.
Figure 6. (A) Unrisked exceedance curve (black) and probability density function (gray) showing the range of volumes predicted if the success case model is correct. In the event of geological success, the model is correct. The minimum volume in the success case is the P100; there is an n% chance that the volume will exceed the Pn value. (B) Risked curves, showing the absolute chance of exceeding the same volumes. (C) Risked curves for a prospect for which some of the geological failure cases may contain hydrocarbons. Pg = chance of geological success.