The AAPG/Datapages Combined Publications Database
AAPG Bulletin
Figure
AAPG Bulletin; Year: 2018; Issue: September DOI: 10.1306/0108181613217061
Return to Full Text

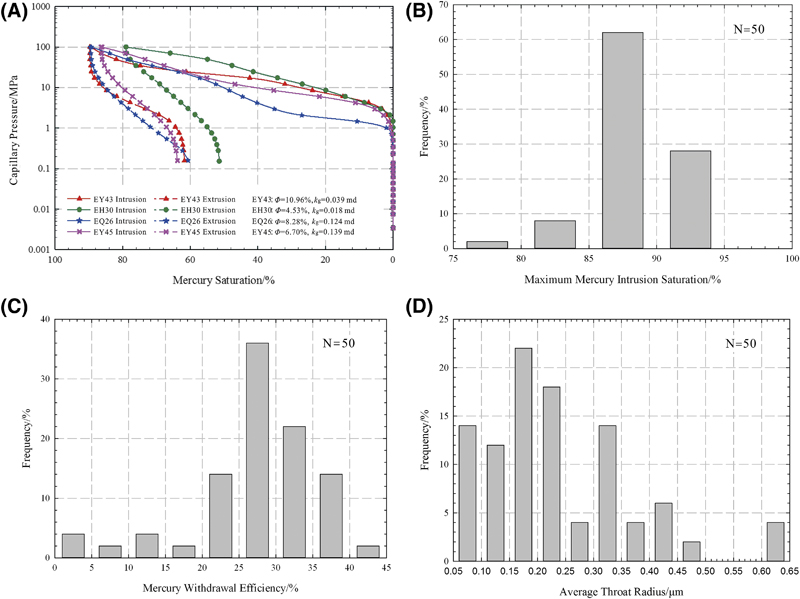
Figure 12. Capillary-pressure curves and throat characteristics based on pressure-controlled mercury injection experiments. The “frequency” on the y-axis (B–D) represents the sample ratio of each interval. (A) Intrusion and extrusion curves. (B) Maximum intrusion mercury saturation distribution. (C) Mercury withdrawal efficiency distribution. (D) Average throat radius distribution. kg = nitrogen permeability; N = number of core samples; φ = porosity.

Figure 12. Capillary-pressure curves and throat characteristics based on pressure-controlled mercury injection experiments. The “frequency” on the y-axis (B–D) represents the sample ratio of each interval. (A) Intrusion and extrusion curves. (B) Maximum intrusion mercury saturation distribution. (C) Mercury withdrawal efficiency distribution. (D) Average throat radius distribution. kg = nitrogen permeability; N = number of core samples; φ = porosity.